Using AI in Trading: Why Claude Adds Speed, Not Judgment
Everyone assumes AI takes the guesswork out of trading research. It doesn't. It just moves the guesswork somewhere you're less likely to check it.
That's not a knock on Claude. We use it constantly. For research, for building tools, for testing strategies faster than we ever could by hand.
But every time we've gotten burned using AI in this business, it's because we forgot one thing. Claude is a fast assistant, not an oracle.
It will write code, crunch numbers, and explain results in seconds. It can also be confidently wrong just as fast.
You are the analyst. Claude is the intern.
Why Does a Confident Answer Feel Like a Correct One?
Here's a real example from our own research. We had Claude calculate Average True Range on our futures data. ATR is a volatility measure we use to size stops and targets.
The number came back roughly four times too big. A normal ~50-point range was showing up as ~200 points.
Claude never flagged it. It just did the math it was asked to do, on the da...
Trading Discipline Lesson: Write the Test Before You Build the Tool
Third time running the same test. Same trade, same broker export, same expected P&L number sitting in a text file since before we wrote a single line of code. I (Reid) had already watched this exact test fail twice. Once because the tool couldn't find its own data file. Once because the output changed every time we ran it. I hit run a third time and didn't move until the number came back.
We were building a position-sizing guardrail tool with Claude. Something to catch us before we oversized a trade or broke our own rules. Round one of review found 14 real problems. A dead data file. Output that wasn't reproducible. A config file referencing settings that didn't actually exist anywhere in the code.
Not small stuff. The kind of stuff that, if it ships, quietly wrecks your risk management the day you need it most.
Fourteen problems is a lot. It's also, it turns out, the least interesting number in this whole story.
Why Does the Same Test Have to Run Every Time?
Here's what actually ...
The Weekend Review Ritual That Keeps Traders Funded
Let’s be honest, you’re probably overtrading.
Not because you’re undisciplined. Because you’re bored. The market goes quiet, the setup you wanted never shows up, and that itch to do something takes over. So you take the trade that isn’t there. That’s the whole mechanism, and it’s the single most common way we watch good traders bleed out.
The 2026 psychology research says the same thing we see in coaching: overtrading, driven by boredom, action-addiction, and the false math that more trades equals more profit, is the top failure mode for retail traders. And the cleanest antidote isn’t a new indicator. It’s a habit you run on the weekend, when the market is closed and can’t tempt you.
What do the best traders actually do on Saturday?
Not stare at charts. That surprises people.
The weekend isn’t for trading, it’s for reviewing the week you already traded. In our community the ritual has three parts, and none of them are exciting. That’s the point.
Step one: review the tape you alre...
Trading Psychology: The One Lesson Behind a Month of Building With AI
Everyone wants one clean result. One backtest that prints green top to bottom. One test suite that passes on the first run. One confident answer from an AI assistant that settles the question so you can stop worrying about it.
We think that want is exactly backwards.
A single good result is never proof. It's a starting point. And if you stop there, you're not managing risk. You're hoping.
Why Do Traders (and Builders) Trust One Good Number?
Because one clean number feels like relief. The backtest worked, so you move on. The code shipped, so you stop testing it. Claude gave you a confident-sounding answer, so you stop asking questions.
This month we walked you through real lessons from building HTA's tools and testing our own strategies alongside Claude. Our Edge & Strategy posts told you straight. We tested 47 strategies. Zero survived full verification.
Every single one looked good at some point. A clean equity curve. A promising win rate. One number that made us want to believe...
Passing Tests ≠ A Working Tool: Our AI Trading Tool Audit Checklist
"If the tests pass, the tool works." That's the assumption almost everyone makes about AI-built software. We made it too. For about twenty minutes.
Earlier this year we had Claude build us a position-sizing guardrail tool. Something to catch us before we sized a trade too big. The first version came back looking sharp. Every test passed. The documentation read like a senior engineer wrote it on a good day. Our gut said ship it.
We didn't. And that decision is the whole point of this post.
What Was A "Perfect" Build Actually Hiding?
I (Reid) run point on our AI builds, so I was the one staring at that first version, ready to call it done. Then we did what we tell every student to do with a new strategy before it touches real money. We audited it instead of trusting it.
What we found wasn't a small bug. It was three of them, stacked underneath a shiny surface.
The tool was reading from a dead data file. A source that no longer existed in the pipeline it was supposedly checking. Run...
Building an AI Trading Risk Tool With Claude: The One Rule We Set Before Writing Any Code
Our position-sizing tool sat quiet for 30 trades before we let it touch anything. It watched real trades come in. It logged what it would have told us to do. It changed nothing.
That wasn’t caution for caution’s sake. That was the plan from day one.
This is post one in a ten-part series on what we’ve actually learned building tools and testing strategies with Claude, Anthropic’s AI. Glenn and I aren’t AI developers by trade. We’re traders who started using Claude to build things we needed and couldn’t buy off the shelf. Some of what we built worked. Some of it didn’t, until we fixed how we were building it. This series is the honest version of that process. What to do, what not to do, no polish added.
Today’s post covers the do’s. Specifically, the three things that kept an AI-built risk tool from ever putting our account in danger, even while it was still rough around the edges.
What’s the One Rule That Comes Before Any Code?
I (Reid) handle most of the AI and content systems at ...
HTA Research Lab: Evidence Over Opinions for Traders
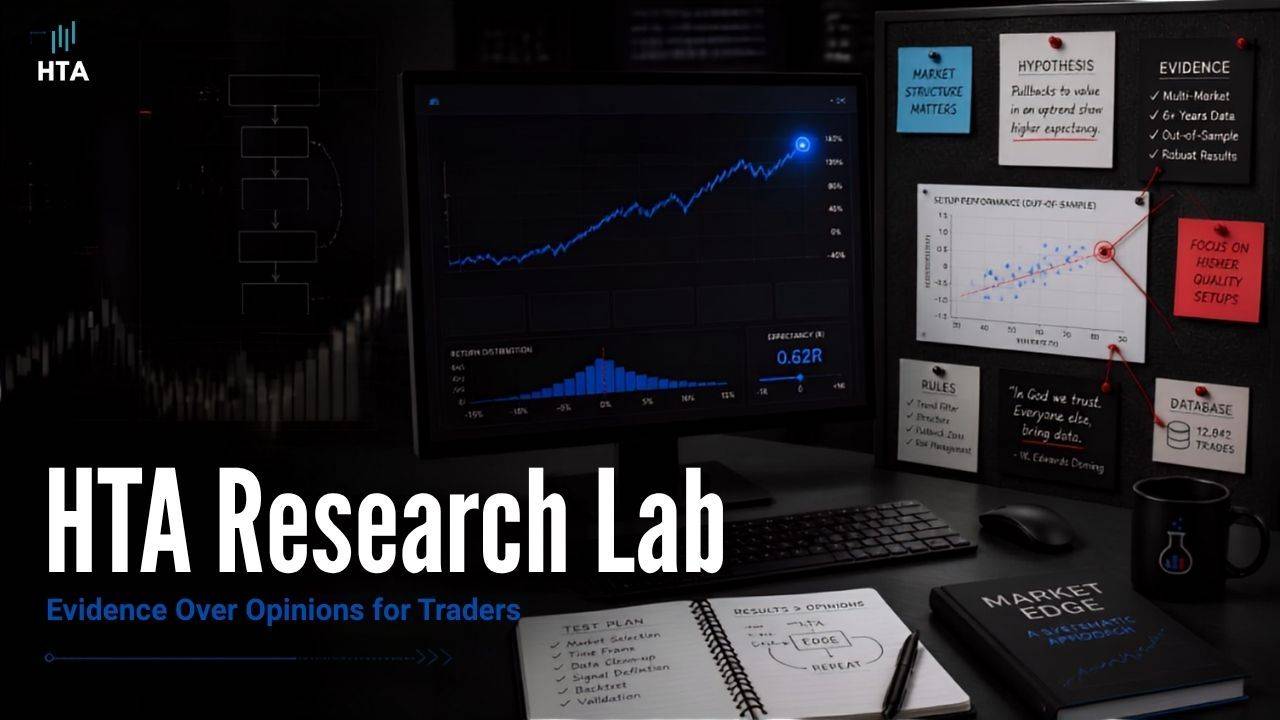
Today we are opening the HTA Research Lab with one simple idea: stop guessing and ask the data.
There is no shortage of futures opinions online. There are calls, predictions, screenshots, hot takes, and clean explanations written after the move already happened. What traders need more of is transparent futures trading research that shows the sample, the condition, the result, and the limitation in the same place.
What the HTA Research Lab Is
The Research Lab is a public market-research experience built around questions traders actually ask about NQ futures. Instead of opening a page and being told what to trade, you choose the market context you care about and inspect what happened historically under a frozen definition.
The MVP starts with NQ only. That is intentional. We would rather launch a smaller set of clear, useful studies than dump 100 research cards into an interface and make traders hunt for the point.
You can explore five main timeframes: 5-minute, 15-minute, 1-hour, 4...
MNQ vs NQ: Which Nasdaq Futures Contract Should a Beginner Trade?
You want to trade Nasdaq futures but there are two contracts staring at you: NQ and MNQ. Same underlying index, same price action, completely different risk profiles. Picking the wrong one for your account size is one of the fastest ways to blow up before you learn anything.
Here is the breakdown so you can make the right call.
What Are NQ and MNQ?
Both contracts track the Nasdaq-100 Index. NQ is the E-mini Nasdaq-100, the full-size contract. MNQ is the Micro E-mini Nasdaq-100, exactly one-tenth the size of NQ. They trade on the same exchange (CME), during the same hours, with the same price movement. The only difference is how much each tick and each point costs you.
Contract Specs Side by Side
NQ (E-mini): $20 per point, $5 per tick (0.25 points), initial margin roughly $18,000+.
MNQ (Micro): $2 per point, $0.50 per tick (0.25 points), initial margin roughly $1,800+.
A 50-point move on NQ = $1,000. That same 50-point move on MNQ = $100. Same chart, same candles, ten times less...