Downside Shocks Hit Harder and Linger Longer
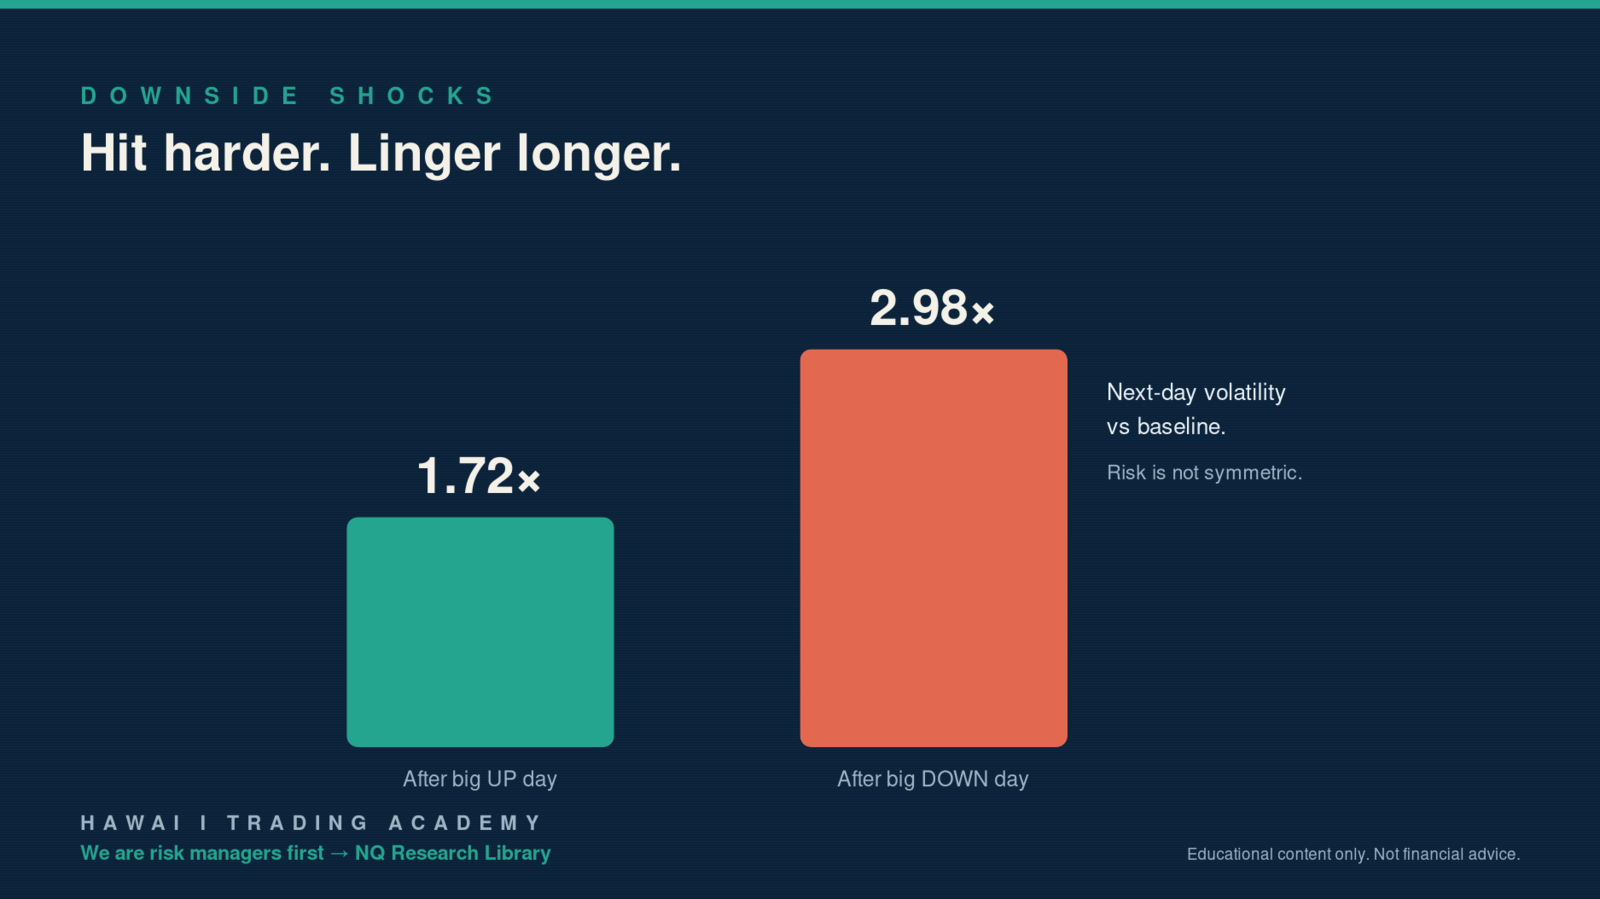
Up moves and down moves are not mirror images. Anyone who traded a real selloff knows it in their gut. We put a number on it for NQ.
We compared the largest down days to the largest up days. After a big down day, next-day volatility ran a median 2.98 times baseline. After a comparably big up day, only 1.72 times.
Fear Moves Faster Than Greed
Selloffs feed on themselves. Margin calls, forced selling, stops cascading. The tape stays wild the day after, and often longer. Rallies tend to be calmer and slower.
233 large-down days and 198 large-up days went into this. It is not a fluke of one crash. It is the shape of the market.
Why This Is a Risk Rule, Not a Trade
This will not tell you to buy or sell. It tells you the environment. The day after a big drop is a high-volatility environment whether you are long, short, or flat. That is when position sizing saves accounts.
Size the same after a selloff as you do on a calm day and you are taking on far more real risk than your positio...
AI Risk Management Tool: Built Dumber On Purpose
Everyone building AI trading tools wants a smarter one. Faster signals. Sharper predictions. A model that "learns" your account and adjusts on the fly.
We went the other direction.
When Glenn and I (Reid) sat down with Claude to build our own position-sizing risk tool, we gave it one job. Get dumber, not smarter. It's allowed to do less. It's never allowed to do more.
That sounds backwards until you remember what this tool touches. Money. Real risk. The kind of decision that, if it's wrong, doesn't just cost you a bad trade. It costs you the account.
When AI touches anything near your capital, "smart" is the wrong goal. "Constrained" is.
What Does "Constrain the Tool" Actually Mean?
Before we wrote a single line of code, we wrote a sentence.
"This tool may only ever REDUCE position size. It may never increase it."
We had Claude repeat that rule back to us before anything else happened. Then every design decision after that got checked against that one line. Every feature. Every...
The 9:30 Open Is the Loudest Five Minutes of the Day
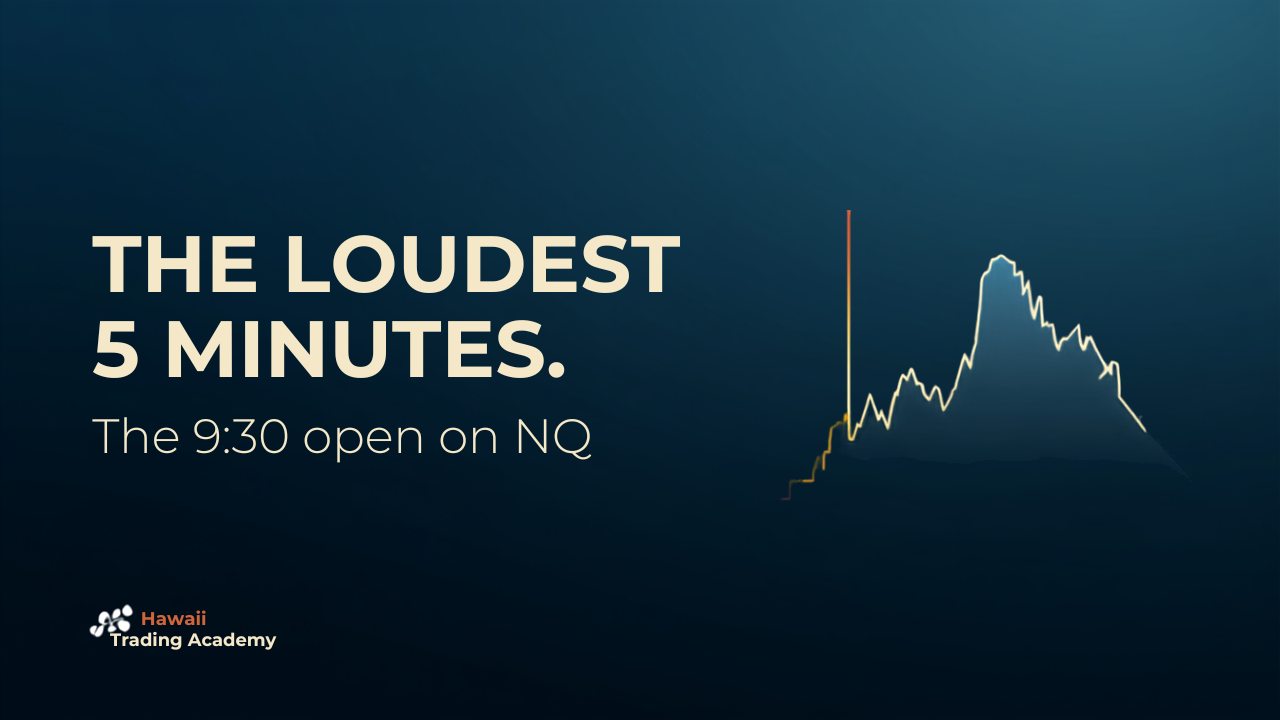
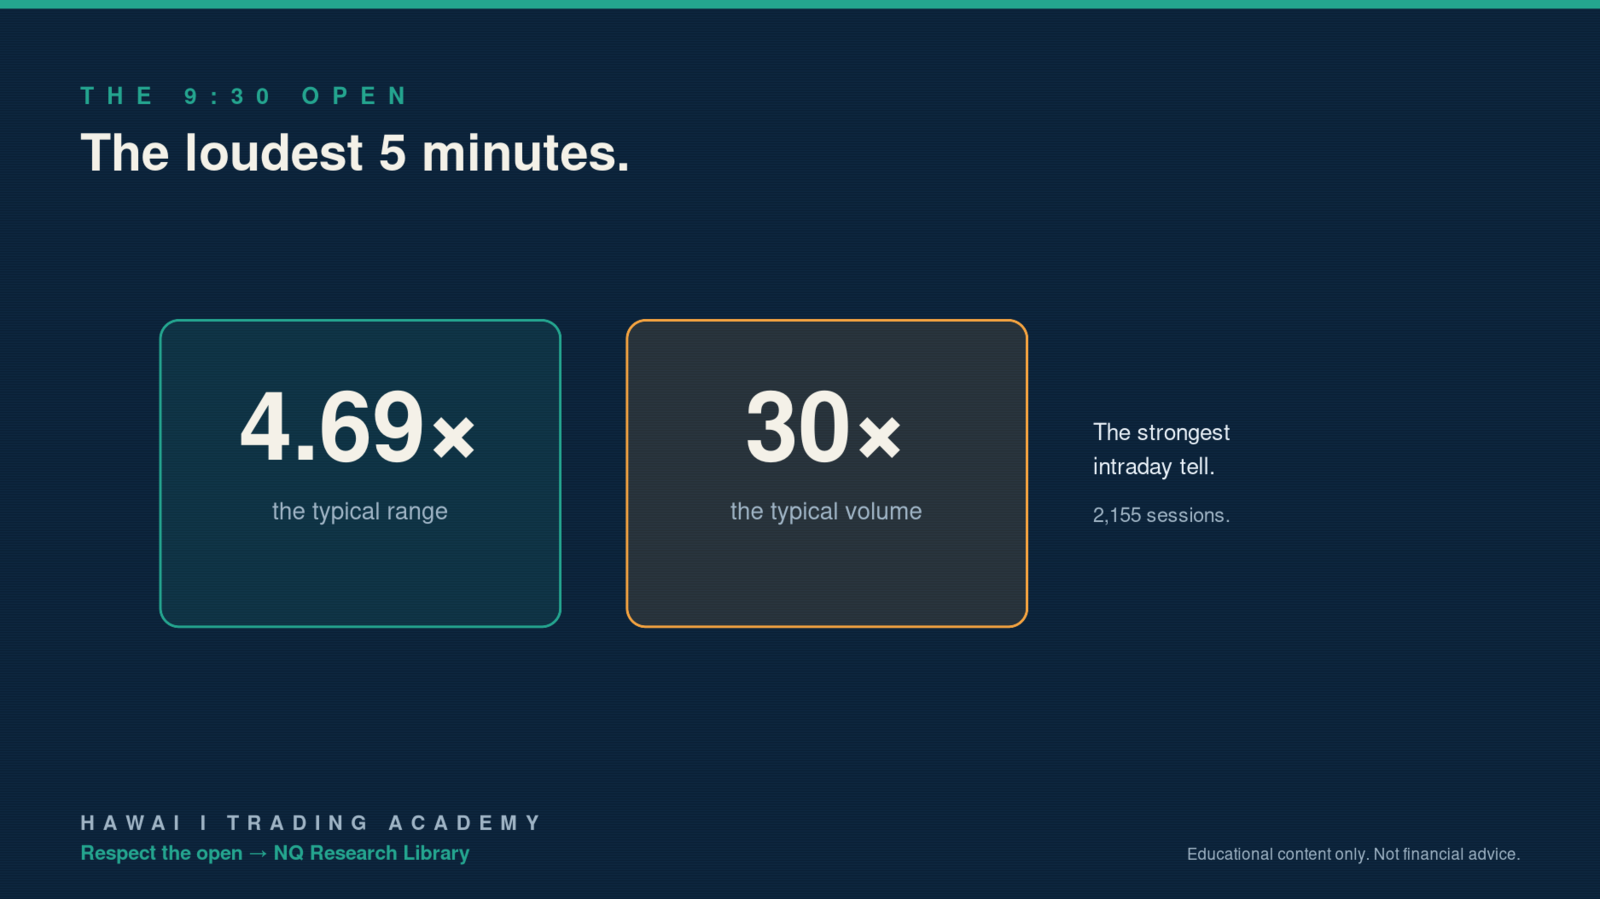
If you only knew one thing about intraday NQ, know this. The open is not like the rest of the day. We measured it across 2,155 sessions.
The 9:30 ET opening five-minute block ran at least 4.69 times the typical range and 30 times the typical volume. The pattern held across every test period.
The Strongest Intraday Tell
Nothing else on the clock comes close. The open is where the day's information gets priced, fast and loud. Volume floods in. Range explodes. Then it settles.
This is the single most reliable time-of-day fact in the NQ library. It is not subtle and it does not fade.
Respect It or Get Run Over
New traders love the open because it moves. That is exactly why it is dangerous. 30 times the volume means the fills are different, the spreads are different, and a normal-sized stop can get blown through in one candle.
The honest use is simple. If you trade the open, size for 5 times the range, not the calm midday range. If you cannot handle that, wait 15 minutes. The clock...
The Identity Shift: From Gambler to Professional Trader
The Identity Shift: From Gambler to Professional Trader
Most traders stay broke because of how they think about themselves, not because of how they trade. This is the identity problem. And until you fix it, no strategy will save you.
A gambler sits down at the table hoping to win. A professional sits down expecting to execute. Same table. Completely different outcomes over time.
Identity Marker #1: Process Over Outcome
Gamblers measure themselves by P&L. "I made $2,000 today" = good. "I lost $500" = bad. This seems logical but it's toxic. It trains you to chase outcomes instead of building process.
Professionals measure themselves by execution quality. "I followed my system on all three trades" = good, regardless of P&L. "I deviated from my rules on a winning trade" = bad, even though you made money. The outcome of a single trade is noise. The quality of your execution is signal.
Identity Marker #2: Small Bets, Long Horizons
Gamblers want the big score. One trade that changes ev...
The Prop Firm Evaluation Math: Burn, EV, and the Real Odds
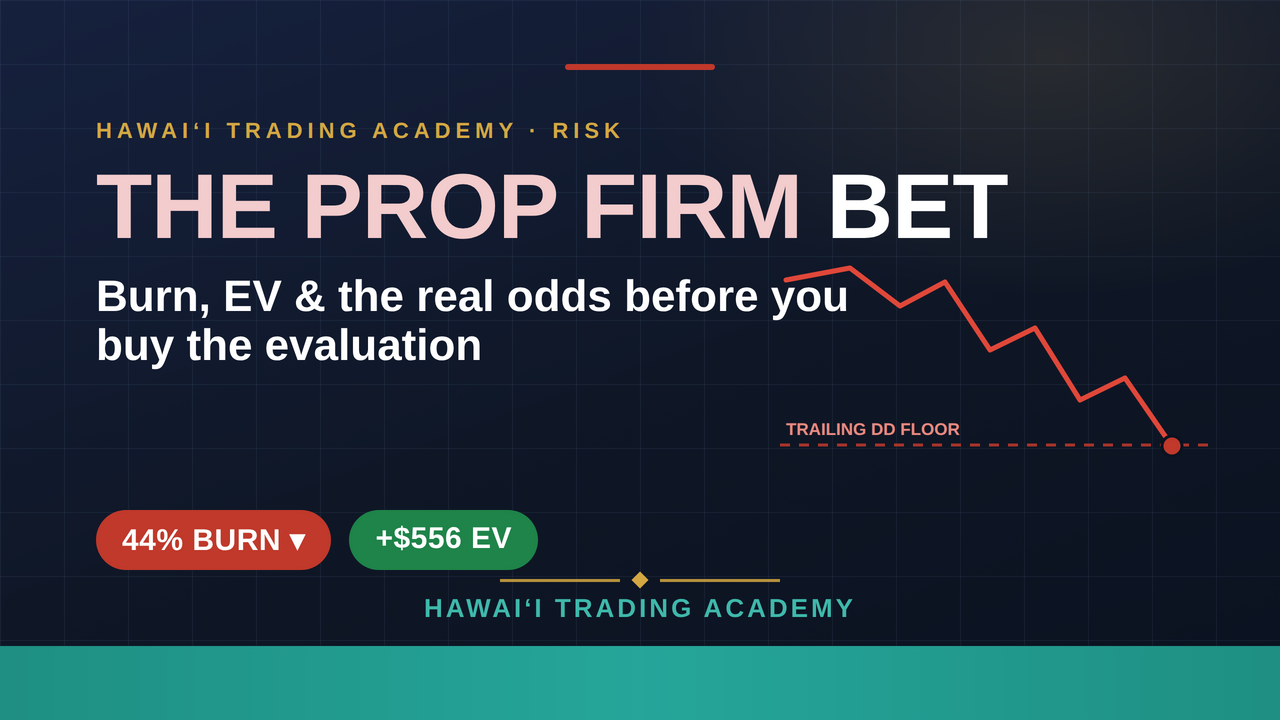
Before you buy another $100K evaluation, run two numbers. Not your win rate. Not your favorite setup. Two numbers decide whether that challenge is a smart bet or a slow leak: how often the account dies before it pays, and what one attempt is worth on average.
At Hawaiʻi Trading Academy, we teach Hawaii trading education the same way we trade. Risk first. A prop firm evaluation is a risk decision, and most traders make it on hope. You see the funded-account dream. You see the small fee. You click buy. The math tells a calmer, more useful story. Let’s run it.
What is “burn” on a prop firm evaluation?
Every evaluation ticket ends one of three ways, and the three always add up to 100%. Path one, it pays. You hit the target, clear the rules, get funded. Path two, it burns. The account gets knocked out before you finish. Path three, it times out. The window closes with no pass and no knockout.
Burn is the one that kills accounts before they pay. Take a common setup. A $100K evaluation wi...
How We Try to Break an Edge Before We Trust It
Here is a stat that should be a trade. In NQ, the first-hour direction matched the closing direction 71.7% of the time, across 2,654 sessions. And a median 59.4% of the whole day's range already existed after that first hour.
Read that fast and you would bet the farm. Follow the first hour, hold to the close, print money.
Our audit ruled it out. On purpose.
Why We Try to Break Our Own Ideas
71.7% agreement sounds like a coin that lands your way three times out of four. But direction agreement is not a trade. When you add the real entry, a real stop, and the cost of getting in and out, the translation from pattern to P&L is where most edges die. This one got flagged failed on execution for exactly that reason.
That is the job of research done right. Not to find things that look good. To find the ones that survive being attacked.
The Whole Library Works This Way
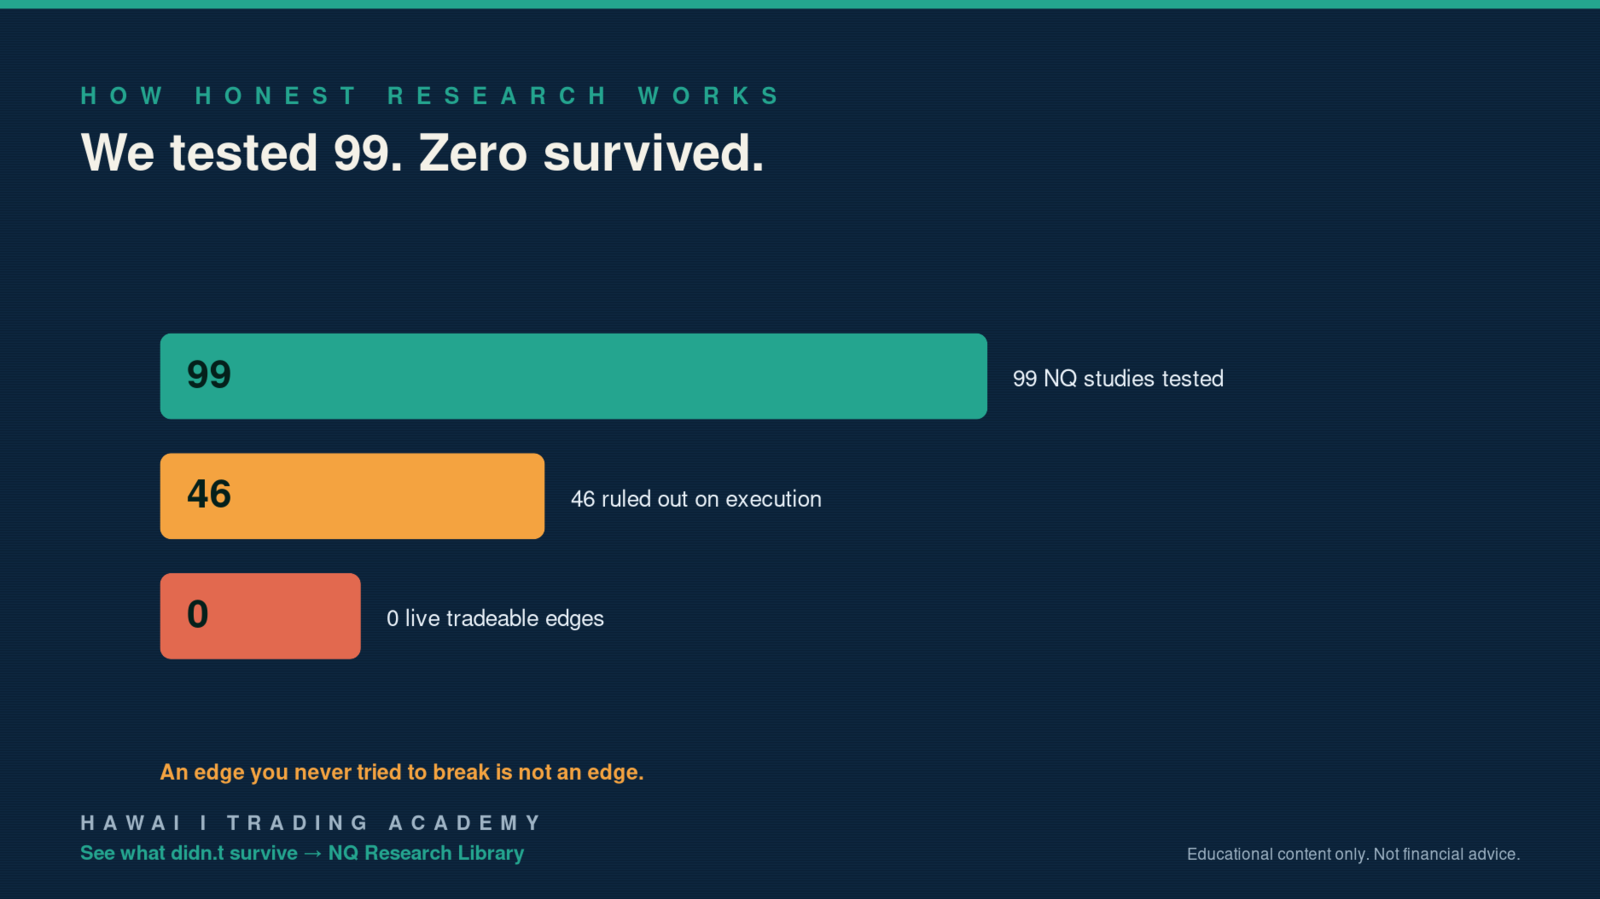
We ran 99 NQ studies. A September audit admitted zero of them as a live tradeable edge. 46 were closed as null or fail...
Decision Fatigue: Why Your Last Trade of the Day Is Your Worst
Decision Fatigue: Why Your Last Trade of the Day Is Your Worst
Your first trade of the day was clean. Good entry. Proper sizing. Stop where it should be. By trade five, you're oversizing, chasing entries, and moving stops. What happened?
Decision fatigue. It's real. It's measurable. And it's destroying your P&L.
The Science
Roy Baumeister's research at Florida State showed that willpower and decision-making draw from the same limited pool of mental energy. Every decision you make — what to eat for breakfast, which route to take to work, whether to enter a trade — depletes that pool.
By the afternoon, you've made hundreds of decisions. Your prefrontal cortex — the part of your brain responsible for rational, deliberate thinking — is running on fumes. Your amygdala — the emotional, reactive part — takes over. This is when you make your worst trades.
How It Shows Up in Trading
Decision fatigue in trading looks like: taking trades that don't meet your criteria because you're "bored....
We Tested 99 NQ Edges. Zero Survived the Data.
We ran 99 separate studies on NQ futures. Big samples too. One pulled from 2.07 million overnight minutes. Another from 3,883 regular-hours sessions. Then we audited every one for a live, tradeable edge.
The number that survived? Zero. Not one.
Sounds like a bad week. It’s the opposite. This is what honest research looks like. It’s also why we don’t sound like every other trading channel. We’re coaches who trade, not salespeople who teach. The new NQ Research Library inside Net Alpha Pro is 99 receipts to prove it.
Why Publish Research That Found No Edge?
Most trading content shows you the winners and buries the graveyard. We built the library the other way. Every study lists its question, its sample size, its result, and its caveat. Then a September 1 audit sorted all 99 into plain buckets. 46 closed as null or ruled out on execution. 25 were useful only as risk-and-range context. The rest were descriptive structure or forward watchlist leads.
Read that again. Forty-six popular...
The Weekend Review Ritual That Keeps Traders Funded
Let’s be honest, you’re probably overtrading.
Not because you’re undisciplined. Because you’re bored. The market goes quiet, the setup you wanted never shows up, and that itch to do something takes over. So you take the trade that isn’t there. That’s the whole mechanism, and it’s the single most common way we watch good traders bleed out.
The 2026 psychology research says the same thing we see in coaching: overtrading, driven by boredom, action-addiction, and the false math that more trades equals more profit, is the top failure mode for retail traders. And the cleanest antidote isn’t a new indicator. It’s a habit you run on the weekend, when the market is closed and can’t tempt you.
What do the best traders actually do on Saturday?
Not stare at charts. That surprises people.
The weekend isn’t for trading, it’s for reviewing the week you already traded. In our community the ritual has three parts, and none of them are exciting. That’s the point.
Step one: review the tape you alre...
Fed Day Whipsaws: Why Chasing the First Move Burns Accounts
Friday handed traders another live lesson. Fed Chair Kevin Warsh stepped up for his first Jackson Hole keynote, and the wires lit up. He said this summer's PCE and CPI readings were better than expected, but they do not tell him underlying inflation has meaningfully improved. Translation for the tape: the door to a rate hike next month cracked open. Chips gave back most of Thursday's Nvidia pop, and the Nasdaq closed lower.
If you traded the first headline print, you probably got faked out. That was not bad luck. That is what a Fed day does.
Why does NQ whipsaw so hard around Fed speakers?
An event like a Warsh speech or an FOMC decision dumps a burst of information into the market in seconds. Algorithms react first, they react fast, and they often react in both directions before the tape settles. You get a violent push one way, a snap back, then sometimes a third move that finally sticks.
That first move is the least reliable bar of the day. It is a knee-jerk, not a decision. NQ i...