Revenge Trading: The 22% Win Rate and the 30-Minute Fix
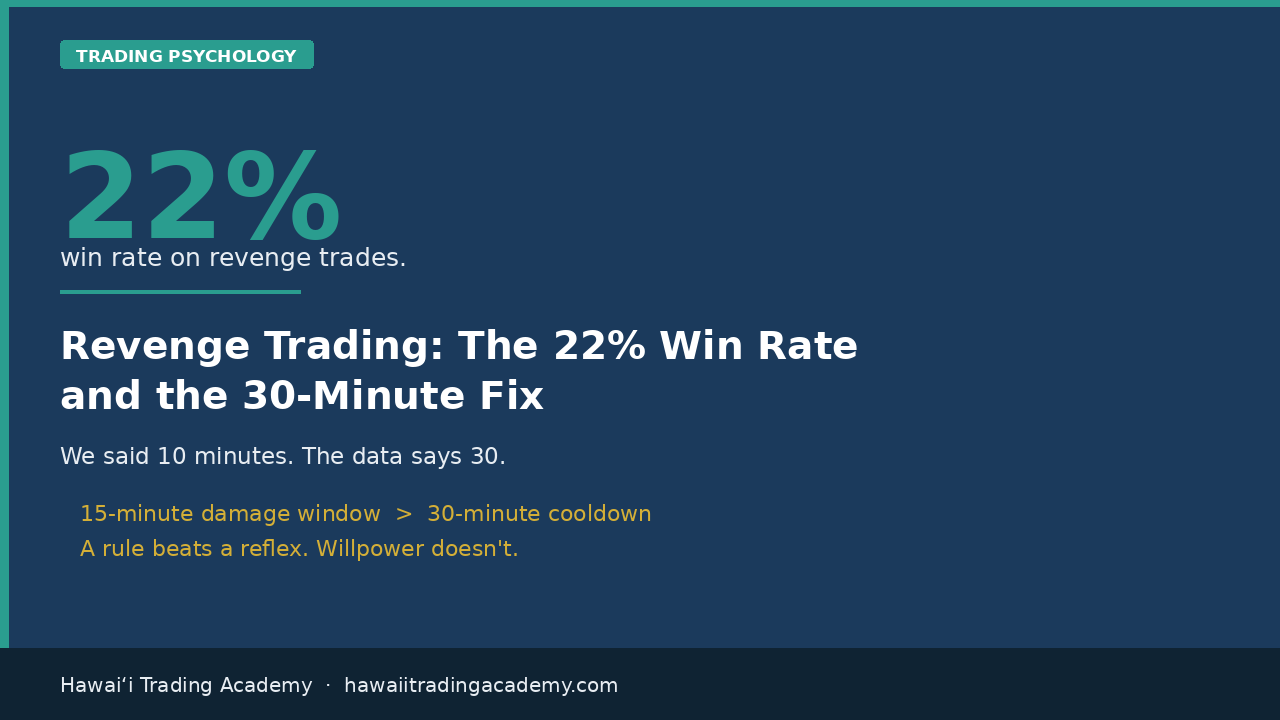
We told you to wait 10 minutes. The data says that is not long enough.
Earlier this month we published a piece on the drawdown reflex, the biological panic response behind roughly 74% of prop firm breaches. In it we gave you a rule: after any loss, wait 10 minutes before entering a new trade. Let the cortisol drop. Let your prefrontal cortex come back online.
That rule was directionally right. The number was wrong. Here is what the revenge trading data changed about our thinking.
What does the revenge trading data actually show?
Revenge trading has a measurable signature. In journal data it shows up as a specific, identifiable trade: an entry placed within 15 minutes of a loss, at larger than normal size.
Filter for those two conditions and the numbers are ugly. Those trades won 22% of the time.
Sit with that for a second. Your strategy might win 55%, 60%, 65%. Our RVOL + VWAP mean reversion setup wins 64% across 4,672 backtested trades. The same trader, on the same day, trading ...
RVOL + VWAP Trading Strategy: 64% Win Rate
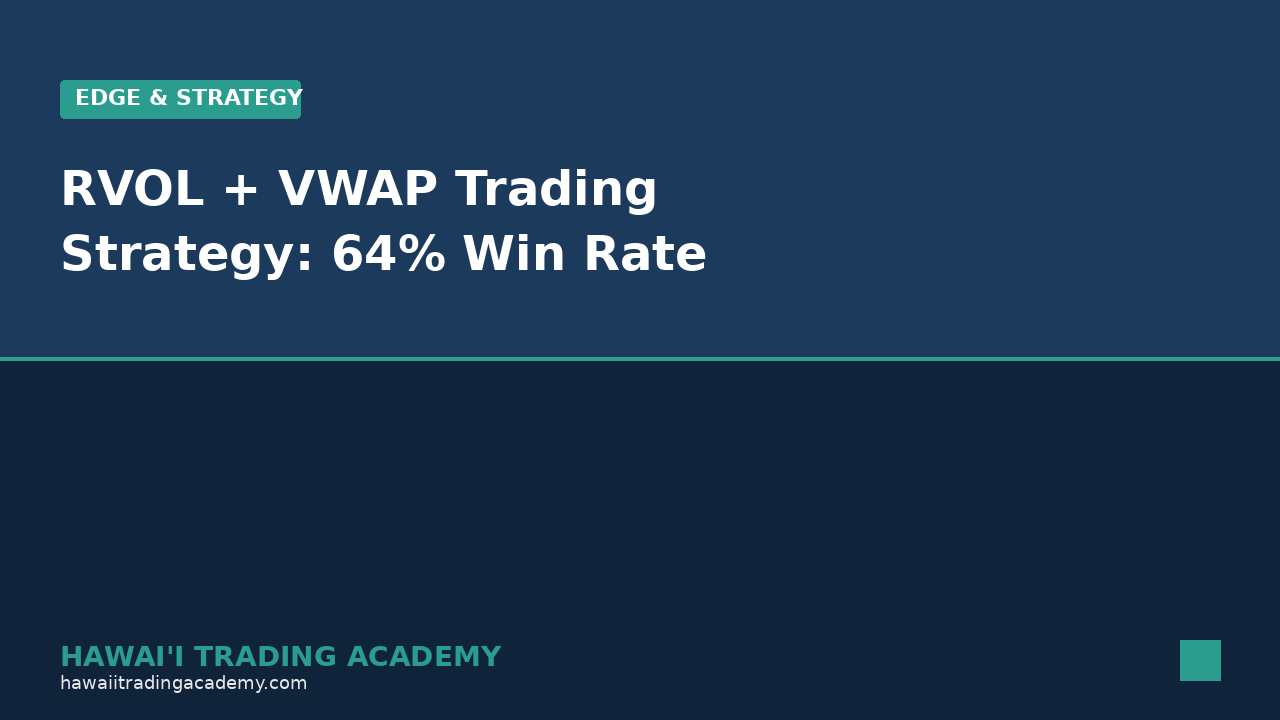
RVOL + VWAP Mean Reversion: 4,672 Trades and a 64% Win Rate
This is our most consistent strategy for one specific scenario: shorting overextended moves on Crude Oil.
The RVOL + VWAP Mean Reversion strategy combines relative volume analysis with VWAP deviation to find high-probability mean reversion entries. It’s Strategy 4 in our Edge Playbook, and it’s the one our students ask about most.
The Data
Across 4,672 backtested trades: Win rate: 64%. The highest of any strategy in our playbook. When you combine that with a favorable R:R, the expectancy is strong and the equity curve is smooth.
The strategy works because RVOL (Relative Volume) acts as a confirmation filter. High RVOL at VWAP deviation means institutional participation — and institutions mean revert. Low RVOL at deviation? That’s noise. Skip it.
How It Works
Setup: Price extends 1+ standard deviations from VWAP while RVOL is above 1.5x average.
Entry: First sign of reversal — a rejection candle, a momentum shift, or a ...
5 Types of Stop Losses: When to Use Each One
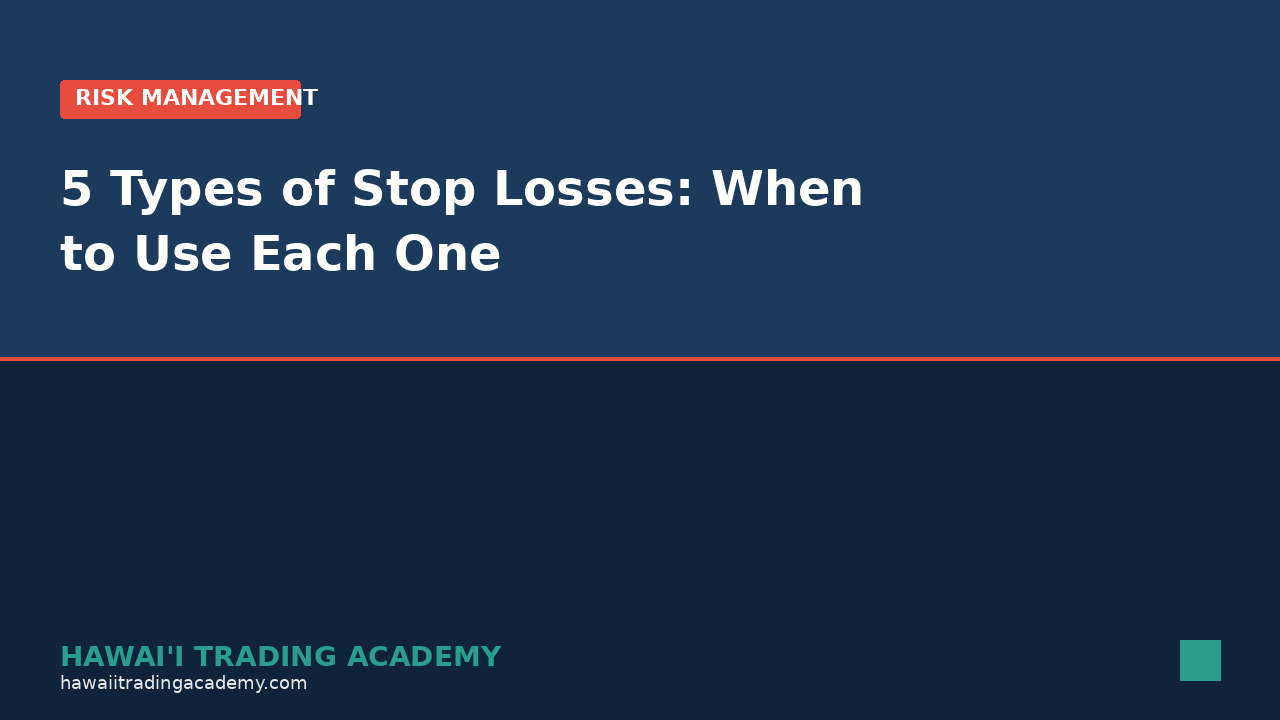
5 Types of Stop Losses and When to Use Each One
Not all stops are created equal. Most traders use one type — the hard stop — and ignore the other four. That’s like owning a toolbox with only a hammer.
Our Risk Management Playbook defines five stop types, each designed for different market conditions and trade setups.
1. Hard Stop
A fixed price level entered at trade entry. Non-negotiable. The platform executes it regardless of your emotions. This is your default — every trade should have one.
When to use: Always. Every single trade. No exceptions.
2. Structural Stop
Placed based on market structure — below support, above resistance, beyond a key level. The logic: if price reaches this level, your thesis is invalidated.
When to use: Mean reversion trades where specific levels define the trade thesis.
3. Trailing Stop
Moves with price as the trade goes in your favor. Locks in profits while giving the trade room to run. We use 3x ATR trails in our breakout strategies.
When to u...
How to Trade NFP Futures: Lessons from May 2026's Shock Report
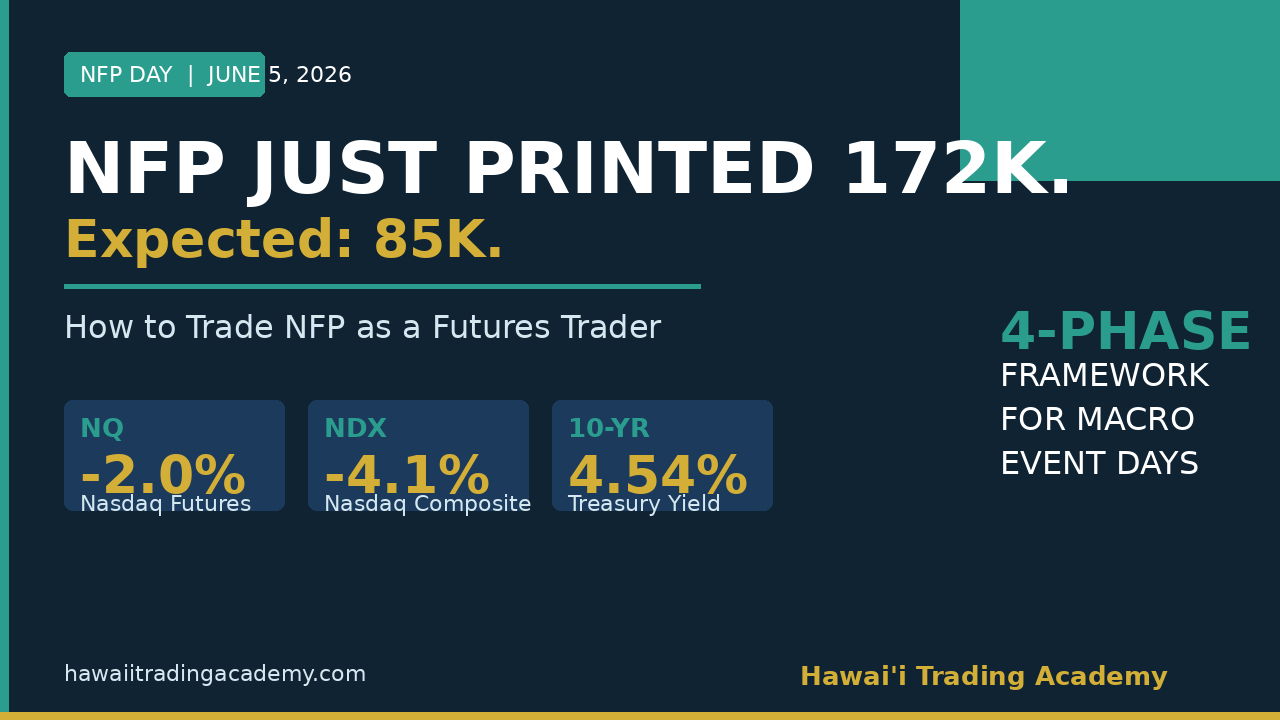
This morning, the May 2026 jobs report printed 172,000 new jobs. The consensus was 85,000.
That's not a miss. That's a near-2x beat on one of the most market-moving data releases of the month.
By the open, the Nasdaq composite was down 4.1%. NQ futures were off nearly 2%. Nvidia dropped 6%. And the 10-year Treasury yield spiked to 4.54% as traders repriced Fed rate hike odds from 50% to 57% overnight.
If you didn't have a plan before 8:30 AM ET today, the market made the decisions for you. This post is about not letting that happen again.
Why Does a Good Jobs Number Tank the Nasdaq?
Before we get into the framework, let's make sure the "why" is clear - because a lot of newer traders are staring at their screens right now confused about why strong employment data would cause a selloff.
Here's the logic: Strong jobs = wage pressure = sticky inflation = Fed keeps rates higher longer = bad for growth stocks = NQ leads the way down.
When 10-year yields jump - they hit 4.54% today - t...
Keltner Channel Breakout Strategy: 302 Trades, $564K P&L
Keltner Channel Breakout: 302 Trades, $564K, and the Highest R:R in Our Playbook
If you want proof that patience pays, this is the strategy.
The Keltner Channel Breakout is Strategy 3 in our Edge Playbook. Only 302 trades across our backtesting period. Far fewer signals than our mean reversion strategies. But when it fires, the numbers are extraordinary.
The Numbers
Across 302 backtested trades on Gold futures (GC), 1-hour timeframe:
Win rate: 51.3%. Just above coin-flip.
Risk-to-Reward: 7.8:1. That’s not a typo. Winners averaged 7.8 times the size of losers.
Gross P&L: $564,000. On 302 trades.
This strategy trades infrequently but swings hard when it does. It’s the opposite of a scalping approach — low frequency, high impact.
How Does It Work?
Keltner Channels use ATR (Average True Range) to create dynamic bands around a moving average. When price breaks outside the channel with volume confirmation, it signals a potential trend move — not a mean reversion.
Entry: Price clos...
Bollinger Band Mean Reversion: 1,180 Trades, 3.55 R:R
Bollinger Band Mean Reversion: 1,180 Trades and a 3.55 R:R
Most people use Bollinger Bands wrong. They see price touch the outer band and think: “breakout!” The data says otherwise. Over 1,180 backtested trades, the highest-expectancy play isn’t the breakout. It’s the snap-back.
Bollinger Band Mean Reversion is one of the five core strategies in our Edge Playbook, and it carries the highest R:R of any strategy we teach.
What Does the Data Say?
Across 1,180 trades in our TrendSpider backtesting:
Win rate: 49.3%. Less than a coin flip. But win rate is only half the equation.
Risk-to-Reward: 3.55. When this strategy wins, it wins big.
Expectancy: +1.243R per trade. Every trade, on average, returns 1.24 times your risk.
Why Does a Sub-50% Win Rate Strategy Work?
Because expectancy is what matters, not win rate. A strategy that wins 49% of the time but makes 3.55x on winners is massively profitable over a large sample.
The psychological challenge: you’ll lose more often than you w...
The Drawdown Throttle: Auto-Reduce Risk Before Blowup
The Drawdown Throttle: How to Auto-Reduce Risk Before You Blow Up
Every blown account has the same autopsy: the trader kept full size during a drawdown.
They knew they were losing. They felt the tilt building. And instead of throttling down, they pressed harder — trying to make it back in one trade. The math was against them before their finger hit the buy button.
At HTA, we built a system that makes throttling automatic. We call it the Drawdown Throttle, and it’s the single most important risk architecture you can install in your trading.
How Does the Drawdown Throttle Work?
It’s a pre-set system of position size reductions tied to drawdown thresholds. No judgment calls. No “I’ll be careful.” The rules trigger automatically based on where your equity sits.
Here’s a simple version:
Level 1 — Down 2% on the day: Cut position size by 50%. You’re still in the game, but with half the exposure.
Level 2 — Down 3% on the day: Stop trading. Pau. Close the platform. You’re done for the ...
POC/VWAP Acceptance Strategy: 2,762 Trades Backtested
We backtested 2,762 trades on a single strategy. 62.7% strike rate. 2.00 R:R. $178,000 in cumulative P&L.
Those numbers aren't a sales pitch. They're a dataset. And the difference between a pitch and a dataset is that a dataset tells you exactly where the strategy doesn't work, too.
Today we're opening the hood on the POC/VWAP Acceptance strategy what it is, why it works, and the conditions that make it fail. Because if you don't know when your edge disappears, you don't really have an edge.
What Is the POC/VWAP Acceptance Strategy?
This is a mean reversion strategy built around two key levels: the Point of Control (POC) from the previous session's volume profile, and the anchored VWAP. When price returns to and "accepts" these levels — meaning it trades there with volume confirmation rather than just spiking through — it creates a high-probability setup.
The logic is straightforward: the POC represents where the most volume traded, which is the market's consensus on fair value. V...
7 Cognitive Biases Costing You Money in the Markets
You think you're rational when you trade. You're not. Nobody is.
Your brain comes pre-loaded with shortcuts that helped your ancestors survive in the wild. Problem is, those same shortcuts are absolute garbage for financial decision-making. They fire automatically, they feel logical, and they cost you real money.
Here are the seven that hurt traders the most — and what you can actually do about each one.
1. Loss Aversion: Why Losses Hurt 2x More Than Wins Feel Good
Losing $500 feels roughly twice as painful as winning $500 feels good. This isn't philosophy — it's neuroscience. The result? You hold losers too long (hoping they'll come back) and cut winners too short (locking in gains before they evaporate).
The fix: Hard stops. Not mental stops — real orders in the platform. If the stop is placed before you enter, your emotional brain doesn't get a vote on when you exit.
2. Confirmation Bias: Seeing What You Want to See
Once you have a thesis, your brain actively filters informat...
The Discipline Paradox: Why Trying Harder Hurts Trading
Every trading mentor tells you the same thing: "You just need more discipline."
They're wrong.
Not because discipline doesn't matter — it absolutely does. But because the way most traders pursue discipline is backwards. They try to muscle through bad decisions with willpower. They white-knuckle their way through sessions. And when willpower runs out (it always does), they blame themselves for lacking discipline.
The paradox is this: the more you rely on discipline, the less disciplined you become. The solution isn't more effort. It's better architecture.
What Is the Architecture Principle?
At HTA, we teach what we call the Architecture Principle: don't rely on in-the-moment decisions. Build systems that make the right behavior the default behavior.
Think about it like a gym habit. The person who "decides" to go to the gym every morning will eventually skip. The person who lays out their gym clothes the night before, drives past the gym on their commute, and has a training partner...