5 Types of Stop Losses: When to Use Each One
5 Types of Stop Losses and When to Use Each One
Not all stops are created equal. Most traders use one type — the hard stop — and ignore the other four. That’s like owning a toolbox with only a hammer.
Our Risk Management Playbook defines five stop types, each designed for different market conditions and trade setups.
1. Hard Stop
A fixed price level entered at trade entry. Non-negotiable. The platform executes it regardless of your emotions. This is your default — every trade should have one.
When to use: Always. Every single trade. No exceptions.
2. Structural Stop
Placed based on market structure — below support, above resistance, beyond a key level. The logic: if price reaches this level, your thesis is invalidated.
When to use: Mean reversion trades where specific levels define the trade thesis.
3. Trailing Stop
Moves with price as the trade goes in your favor. Locks in profits while giving the trade room to run. We use 3x ATR trails in our breakout strategies.
When to u...
How to Trade NFP Futures: Lessons from May 2026's Shock Report
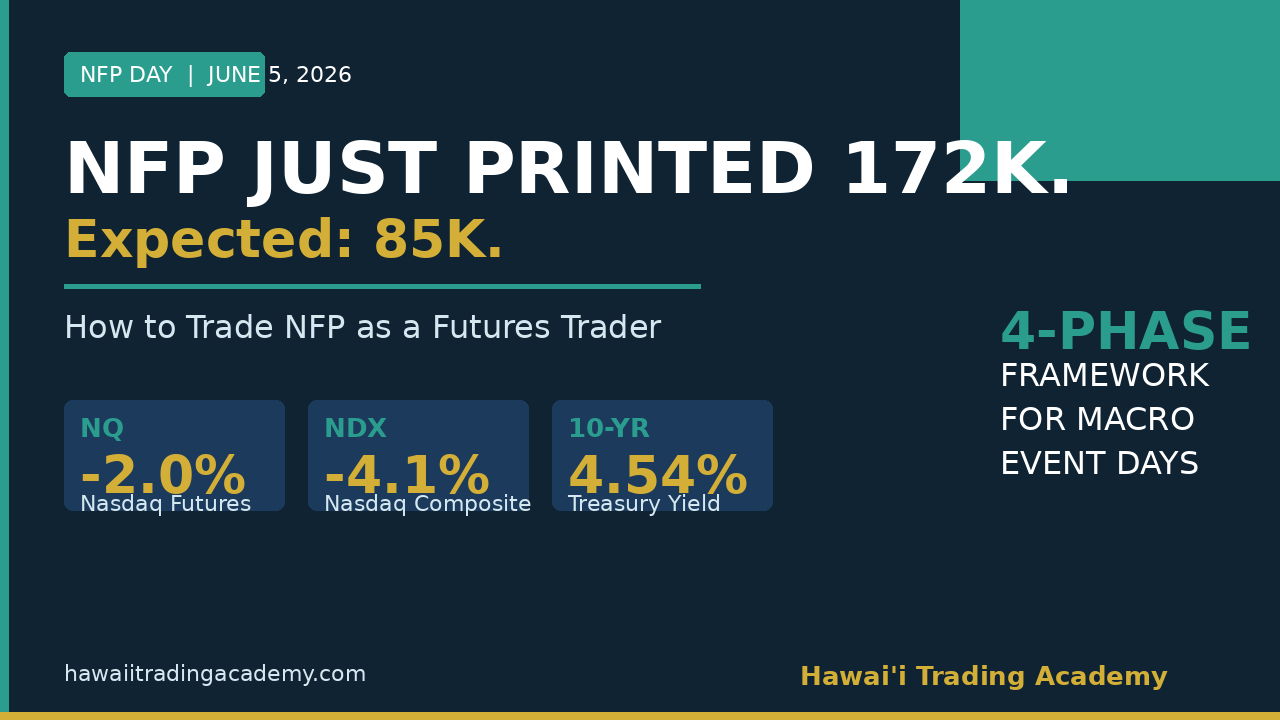
This morning, the May 2026 jobs report printed 172,000 new jobs. The consensus was 85,000.
That's not a miss. That's a near-2x beat on one of the most market-moving data releases of the month.
By the open, the Nasdaq composite was down 4.1%. NQ futures were off nearly 2%. Nvidia dropped 6%. And the 10-year Treasury yield spiked to 4.54% as traders repriced Fed rate hike odds from 50% to 57% overnight.
If you didn't have a plan before 8:30 AM ET today, the market made the decisions for you. This post is about not letting that happen again.
Why Does a Good Jobs Number Tank the Nasdaq?
Before we get into the framework, let's make sure the "why" is clear - because a lot of newer traders are staring at their screens right now confused about why strong employment data would cause a selloff.
Here's the logic: Strong jobs = wage pressure = sticky inflation = Fed keeps rates higher longer = bad for growth stocks = NQ leads the way down.
When 10-year yields jump - they hit 4.54% today - t...
Keltner Channel Breakout Strategy: 302 Trades, $564K P&L
Keltner Channel Breakout: 302 Trades, $564K, and the Highest R:R in Our Playbook
If you want proof that patience pays, this is the strategy.
The Keltner Channel Breakout is Strategy 3 in our Edge Playbook. Only 302 trades across our backtesting period. Far fewer signals than our mean reversion strategies. But when it fires, the numbers are extraordinary.
The Numbers
Across 302 backtested trades on Gold futures (GC), 1-hour timeframe:
Win rate: 51.3%. Just above coin-flip.
Risk-to-Reward: 7.8:1. That’s not a typo. Winners averaged 7.8 times the size of losers.
Gross P&L: $564,000. On 302 trades.
This strategy trades infrequently but swings hard when it does. It’s the opposite of a scalping approach — low frequency, high impact.
How Does It Work?
Keltner Channels use ATR (Average True Range) to create dynamic bands around a moving average. When price breaks outside the channel with volume confirmation, it signals a potential trend move — not a mean reversion.
Entry: Price clos...
Bollinger Band Mean Reversion: 1,180 Trades, 3.55 R:R
Bollinger Band Mean Reversion: 1,180 Trades and a 3.55 R:R
Most people use Bollinger Bands wrong. They see price touch the outer band and think: “breakout!” The data says otherwise. Over 1,180 backtested trades, the highest-expectancy play isn’t the breakout. It’s the snap-back.
Bollinger Band Mean Reversion is one of the five core strategies in our Edge Playbook, and it carries the highest R:R of any strategy we teach.
What Does the Data Say?
Across 1,180 trades in our TrendSpider backtesting:
Win rate: 49.3%. Less than a coin flip. But win rate is only half the equation.
Risk-to-Reward: 3.55. When this strategy wins, it wins big.
Expectancy: +1.243R per trade. Every trade, on average, returns 1.24 times your risk.
Why Does a Sub-50% Win Rate Strategy Work?
Because expectancy is what matters, not win rate. A strategy that wins 49% of the time but makes 3.55x on winners is massively profitable over a large sample.
The psychological challenge: you’ll lose more often than you w...
POC/VWAP Acceptance Strategy: 2,762 Trades Backtested
We backtested 2,762 trades on a single strategy. 62.7% strike rate. 2.00 R:R. $178,000 in cumulative P&L.
Those numbers aren't a sales pitch. They're a dataset. And the difference between a pitch and a dataset is that a dataset tells you exactly where the strategy doesn't work, too.
Today we're opening the hood on the POC/VWAP Acceptance strategy what it is, why it works, and the conditions that make it fail. Because if you don't know when your edge disappears, you don't really have an edge.
What Is the POC/VWAP Acceptance Strategy?
This is a mean reversion strategy built around two key levels: the Point of Control (POC) from the previous session's volume profile, and the anchored VWAP. When price returns to and "accepts" these levels — meaning it trades there with volume confirmation rather than just spiking through — it creates a high-probability setup.
The logic is straightforward: the POC represents where the most volume traded, which is the market's consensus on fair value. V...
Positive Expectancy Explained: Does Your Strategy Work?
What if the strategy you've been trading for six months has a negative edge — and you have no idea?
Most traders can't answer one simple question: does your strategy actually make money over time? Not "does it feel profitable." Not "did it work last week." Does the math confirm a statistical advantage?
If you can't answer that with a number, you're not trading. You're gambling with extra steps.
What Is Positive Expectancy?
Positive expectancy means that over a large enough sample of trades, your strategy produces a net profit. Simple concept. Shockingly few traders actually verify it.
The formula is straightforward:
Expectancy = (Win Rate × Avg Win) – (Loss Rate × Avg Loss)
If that number is positive, you have an edge. If it's negative, you're bleeding money no matter how good your risk management is. You can't risk-manage your way out of a losing strategy.
At HTA, we don't let anyone trade a strategy live until they've confirmed positive expectancy across at least 100 trades i...