Why Most Traders Lose Money (And What Actually Fixes It)
Here's a number that should make you uncomfortable: somewhere between 74% and 89% of retail traders lose money. That range comes from broker disclosures, FINRA reports, and academic studies spanning over a decade. The exact number depends on the asset class and time horizon, but the direction never changes.
Most traders already know this. They've read it in every "top 10 trading tips" article on the internet. And then they do the same thing everyone else does - they go looking for a better strategy.
That's the wrong move.
What Does the Data Actually Say?
A 2019 study out of Brazil tracked 19,646 day traders over two years. 97% of them lost money after 300 days. Not "didn't beat the market" - lost money. The ones who stuck around long enough to be profitable? They made an average of $310 per day. The median was closer to $54.
FINRA data shows 72% of day traders ended their most recent year with financial losses. And more than 75% quit within two years.
Those numbers look like a st...
Futures vs Stocks for Small Accounts: What Actually Changed in 2026
For over twenty years, the Pattern Day Trader rule kept anyone with less than $25,000 from actively day trading stocks. Futures traders never had that problem. As of June 4, 2026, FINRA eliminated the PDT rule entirely. The $25,000 minimum is gone.
So does that mean stocks and futures are on equal footing now? Not even close. Here is what actually changed, what stayed the same, and why futures still have structural advantages for traders with smaller accounts.
What the PDT Rule Was (and Why It Mattered)
The Pattern Day Trader rule was a FINRA regulation that flagged anyone making four or more day trades in five business days on a margin account. Once flagged, you needed $25,000 in equity to keep trading. Fall below that number and your account was restricted.
This locked out most retail traders. If you had a $5,000 or $10,000 account, you were limited to three round trips per week. Miss a clean exit because you were out of day trades? Tough. Hold overnight and hope. That restrictio...
The Daily Trading Routine of a Disciplined Trader
Most traders spend hours studying setups, indicators, and strategies. Almost none of them have a repeatable daily routine. That gap is where discipline breaks down - not during the trade, but before and after it.
A trading routine is not a productivity hack. It is the structure that keeps your decision-making consistent when the market is trying to pull you off your plan. Here is a complete pre-market, in-session, and post-session routine you can adapt to your own schedule and trading style.
Pre-Market: Set the Day Before It Starts
Your pre-market routine should take 15 to 30 minutes. The goal is simple: know what the market is doing before you place a single order. Skip this and you are reacting to price instead of trading a plan.
Start with the economic calendar. Check for scheduled events like CPI, FOMC, NFP, or GDP releases. If a high-impact event is on the calendar, decide in advance whether you will trade through it or sit it out. This decision should be made before the sessi...
5 Types of Stop Losses: When to Use Each One
5 Types of Stop Losses and When to Use Each One
Not all stops are created equal. Most traders use one type — the hard stop — and ignore the other four. That’s like owning a toolbox with only a hammer.
Our Risk Management Playbook defines five stop types, each designed for different market conditions and trade setups.
1. Hard Stop
A fixed price level entered at trade entry. Non-negotiable. The platform executes it regardless of your emotions. This is your default — every trade should have one.
When to use: Always. Every single trade. No exceptions.
2. Structural Stop
Placed based on market structure — below support, above resistance, beyond a key level. The logic: if price reaches this level, your thesis is invalidated.
When to use: Mean reversion trades where specific levels define the trade thesis.
3. Trailing Stop
Moves with price as the trade goes in your favor. Locks in profits while giving the trade room to run. We use 3x ATR trails in our breakout strategies.
When to u...
Prop Firm Trading Rules Every Trader Must Know
Most prop firm traders do not fail because of bad strategy. They fail because they break a rule they did not fully understand. Daily loss limits, trailing drawdowns, consistency rules, news blackouts - these are not suggestions. They are hard boundaries, and one violation can end your evaluation or pull your funded account.
Here is a plain-English breakdown of the rules you will encounter at nearly every futures prop firm, what they actually mean in practice, and how to stay on the right side of all of them.
The Daily Loss Limit
The daily loss limit caps how much you can lose in a single trading day. Most futures prop firms set this at 2% to 5% of your account balance. On a $50,000 evaluation, that is $1,000 to $2,500. Hit that number and your trading is locked for the day. In some cases, one breach ends the entire evaluation.
The calculation method matters. Some firms use your starting balance at the daily reset. Others use real-time equity, which means unrealized losses on open p...
Stop Trying to Control Your Emotions. Build a System Instead.
Every trading psychology article you have ever read says the same thing: control your emotions. Stay disciplined. Be patient. Manage your fear and greed.
And you have probably tried. You told yourself you would stick to the plan. You white-knuckled through a drawdown. You swore you would stop revenge trading.
Then the next red day hit, and all of that went out the window.
Here is the problem: willpower is a finite resource. It depletes under stress, which is exactly when you need it most. Trying to out-discipline the market is like trying to outrun a car. You might keep up for a block, but you are going to lose.
The traders who actually win long-term? They stopped relying on willpower years ago. They built systems instead.
Why Emotional Control Is the Wrong Goal
Mark Douglas wrote about this decades ago in Trading in the Zone: the goal is not to eliminate emotions. You are human. You are going to feel fear when your P&L is deep red. You are going to feel greed when a runner keeps...
The SpaceX IPO Just Broke Records. Here's What NQ Traders Need to Know.

SpaceX went public on June 12, 2026. SPCX opened at $150, closed at $161, and finished the day up 19%. Largest IPO in stock market history. $2.2 trillion market cap on day one.
If you trade NQ futures, this matters. Not because of the hype. Because of the mechanics behind it.
The SpaceX IPO triggered a capital rotation event that will ripple through Nasdaq-100 constituents for weeks. If you don't understand how that works, you're trading blind in a structurally different market.
What Actually Happened on June 12?
SpaceX raised $75 billion by selling 556.6 million shares at $135 each. The stock listed on Nasdaq under the ticker SPCX. By close, the market cap hit $2.2 trillion - putting SpaceX alongside Nvidia, Apple, Alphabet, Microsoft, and Amazon as one of only six U.S. companies to cross that threshold.
That's the headline. The part that matters for futures traders is what happened underneath.
Investors needed cash to buy SPCX. Where did that cash come from? They sold existing ...
4 Stages of Trading Tilt: Catch It Before You Blow Up
The 4 Stages of Trading Tilt
Tilt isn’t an on/off switch. It’s a progression.
Stage 1: The Trigger
Something goes wrong. An unexpected stop-out. At Stage 1, you’re still rational. Circuit breaker: Pause 90 seconds after any unexpected loss.
Stage 2: The Simmer
Frustration builds quietly. Your criteria loosen. Circuit breaker: Rate every setup A/B/C. Two consecutive B or lower? Stop for the session.
Stage 3: The Escalation
Fully tilted. Sizing up. Moving stops. This is where accounts blow up. Circuit breaker: Drawdown Throttle. Down 2%? Size cuts. Down 3%? Done.
Stage 4: The Aftermath
Guilt, shame, self-criticism. Circuit breaker: Post-session debrief. Diagnose, don’t judge.
Emergency Protocol
Stop. Close all positions. Close the platform. Leave the room.
Free Resource: Download the HTA Trading eBook — The foundation every consistent trader needs, from risk management to trading psychology.
Mahalo for reading and trade well! — Glenn & Reid | Hawai’i Trading Academy
Fre
...How to Trade NFP Futures: Lessons from May 2026's Shock Report
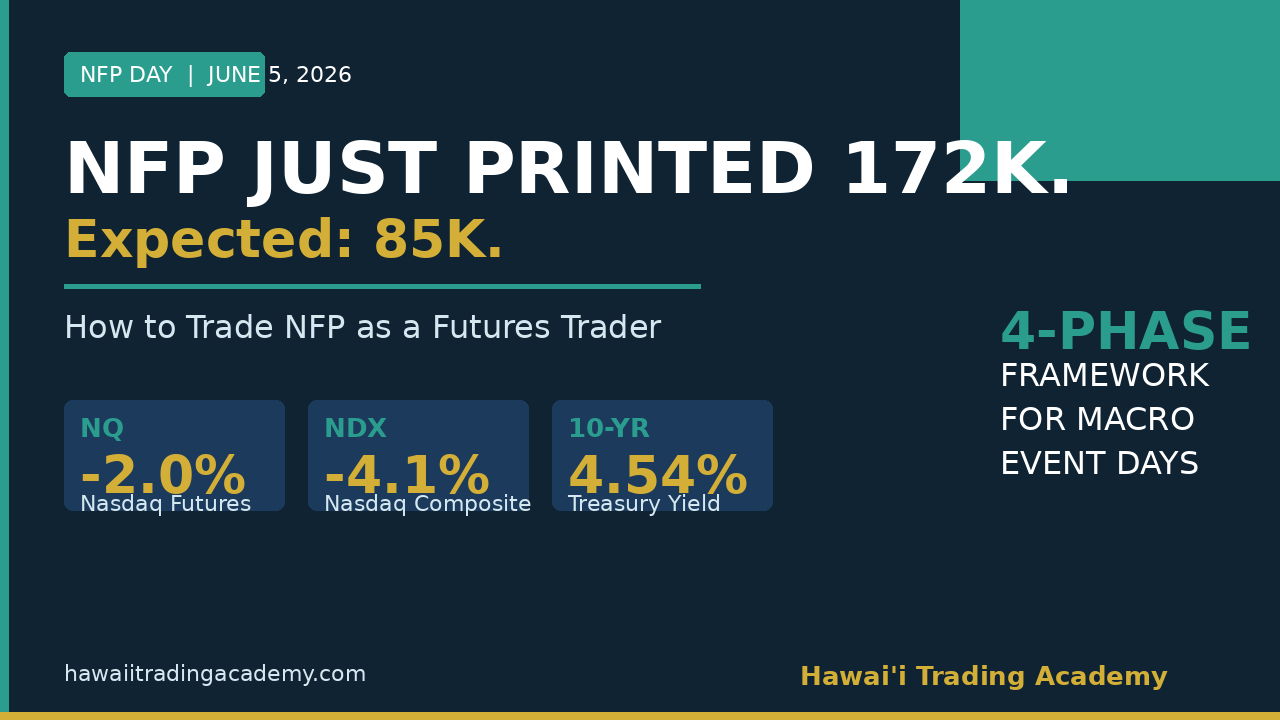
This morning, the May 2026 jobs report printed 172,000 new jobs. The consensus was 85,000.
That's not a miss. That's a near-2x beat on one of the most market-moving data releases of the month.
By the open, the Nasdaq composite was down 4.1%. NQ futures were off nearly 2%. Nvidia dropped 6%. And the 10-year Treasury yield spiked to 4.54% as traders repriced Fed rate hike odds from 50% to 57% overnight.
If you didn't have a plan before 8:30 AM ET today, the market made the decisions for you. This post is about not letting that happen again.
Why Does a Good Jobs Number Tank the Nasdaq?
Before we get into the framework, let's make sure the "why" is clear - because a lot of newer traders are staring at their screens right now confused about why strong employment data would cause a selloff.
Here's the logic: Strong jobs = wage pressure = sticky inflation = Fed keeps rates higher longer = bad for growth stocks = NQ leads the way down.
When 10-year yields jump - they hit 4.54% today - t...
Trading Journal as Psychology Tool: Track Emotions, Not Just P&L
Your Trading Journal Is a Psychology Tool, Not a Scoreboard
Most traders journal wrong. They log entries, exits, P&L, and maybe a chart screenshot. Then they never look at it again.
That’s not journaling. That’s bookkeeping. And bookkeeping doesn’t make you a better trader.
In our Psychology Playbook, the journal is the most powerful tool in your arsenal — but only if you use it to track emotions and behavior, not just numbers.
The 5 Fields That Actually Matter
Beyond the standard entry/exit/P&L, we require five psychology fields in every journal entry:
1. Emotional state at entry. One word. Calm? Anxious? Bored? Excited? Frustrated? This single data point, tracked over 30+ trades, reveals patterns you can’t see in real time.
2. Emotional state at exit. Did it change? If you entered calm and exited panicked, that tells you something about how you handle drawdowns.
3. Setup quality rating (A/B/C). Was this a textbook setup or a “close enough”? Be honest. Over time, you’ll see th...