NQ Futures Statistics: How to Read the Data Correctly
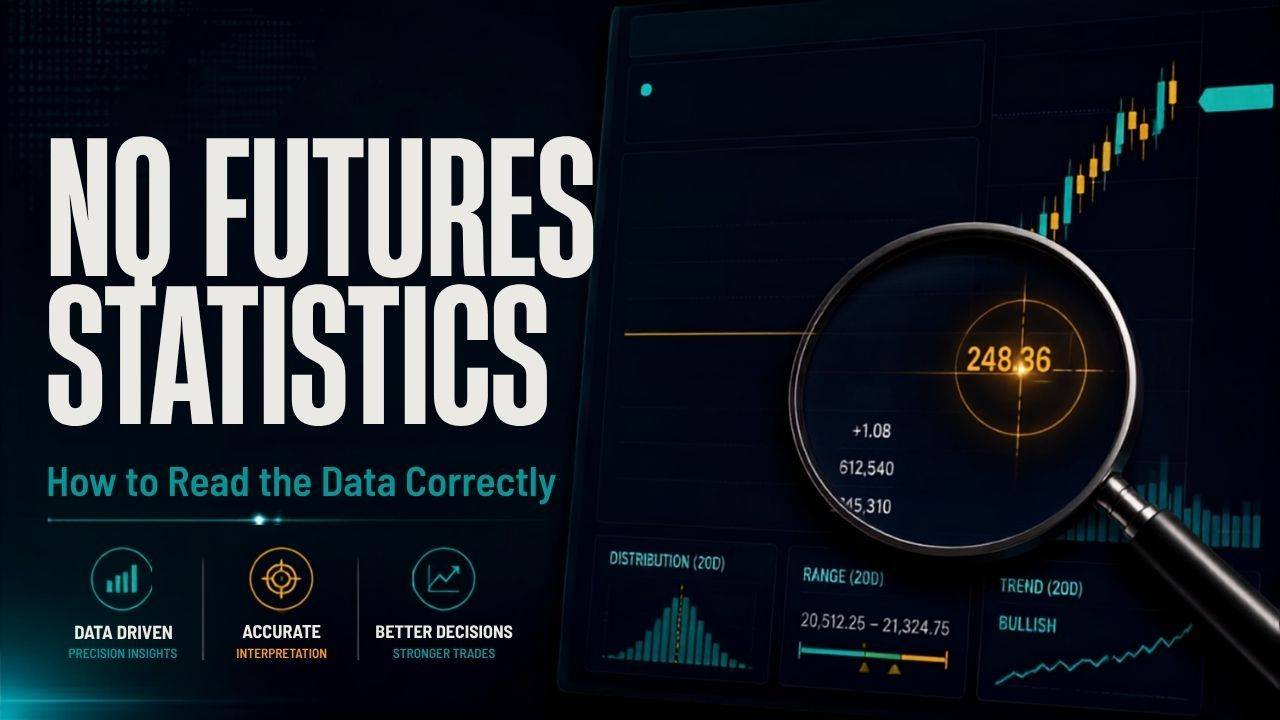
A trading statistic can be technically correct and still lead you to a bad decision. That is the problem with screenshots that say '72% win rate' and stop there. The number might be real, but without the sample, condition, distribution, and downside, you do not know what it actually means.
If the HTA Research Lab is going to be useful, traders need to know how to read NQ futures statistics without turning historical probabilities into predictions. Here is the framework we use.
1. Start With the Definition, Not the Percentage
Before you look at a result, define the event. 'Gap fill' sounds obvious until two traders use different closes, different opens, different sessions, and different thresholds. 'Trend day' is even worse. One person means close above open. Another means one-directional price action with shallow pullbacks. Those are different studies.
A clean research page should tell you exactly how the condition was measured. For NQ, session boundaries matter. So do the timefram...
The Prop Firm Gold Rush Is Over — And That's Good News
Somewhere between 80 and 100 prop firms disappeared in 2024. Not “struggled.” Gone. If you were shopping for a funded account two years ago, a big chunk of the names on your list don’t exist anymore.
That sounds like bad news. We think it’s the opposite.
From roughly 2020 to 2023, the prop-firm world ran on a gold-rush script: cheap challenges, easy funding, big promises, a new firm launching every week. 2026 looks different. The industry now calls it the “operator era” — fewer firms, higher standards, and real weight on trust, risk control, and education. The market quietly repriced hype.
We watched the whole cycle from the coaching side here at Hawai‘i Trading Academy. And the consolidation confirms the thing we built this place around: durable skill beats hype every single time the tide goes out.
What actually happened to all those firms?
Two things, mostly. First, a lot of them were undercapitalized. They sold cheap challenges and paid out on the accounts that passed, quietly ...
HTA Research Lab: Evidence Over Opinions for Traders
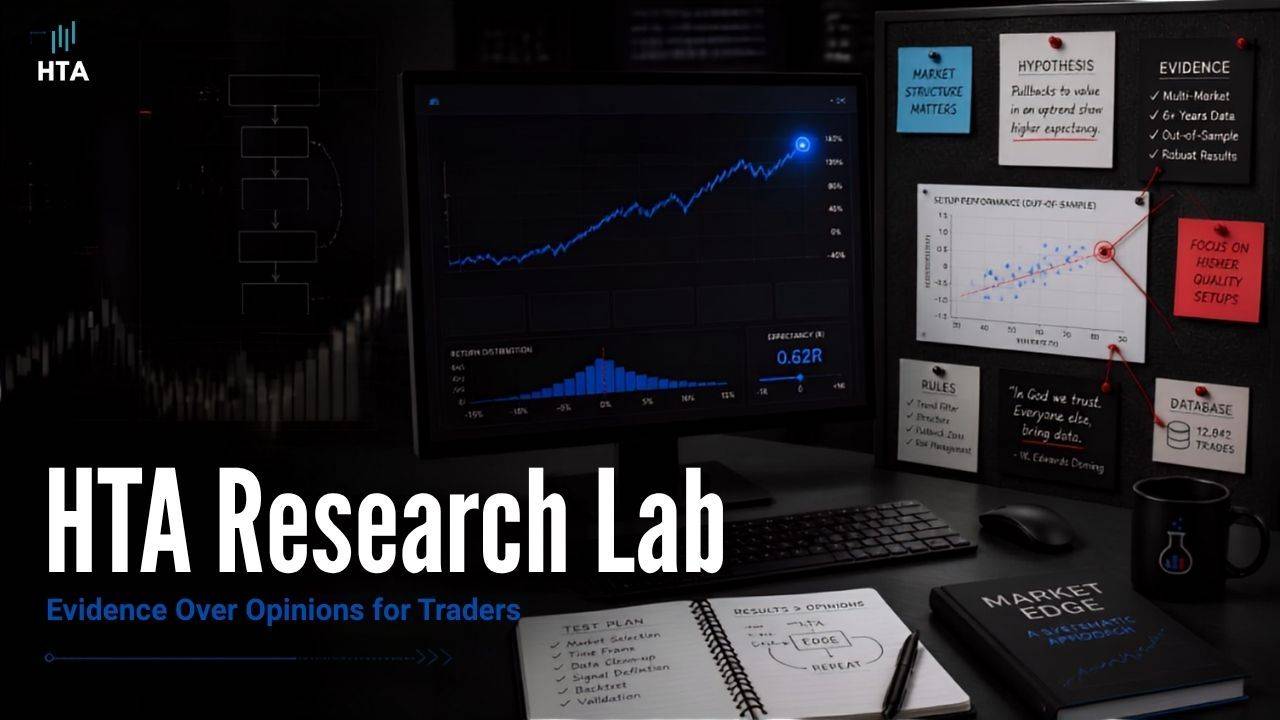
Today we are opening the HTA Research Lab with one simple idea: stop guessing and ask the data.
There is no shortage of futures opinions online. There are calls, predictions, screenshots, hot takes, and clean explanations written after the move already happened. What traders need more of is transparent futures trading research that shows the sample, the condition, the result, and the limitation in the same place.
What the HTA Research Lab Is
The Research Lab is a public market-research experience built around questions traders actually ask about NQ futures. Instead of opening a page and being told what to trade, you choose the market context you care about and inspect what happened historically under a frozen definition.
The MVP starts with NQ only. That is intentional. We would rather launch a smaller set of clear, useful studies than dump 100 research cards into an interface and make traders hunt for the point.
You can explore five main timeframes: 5-minute, 15-minute, 1-hour, 4...
Max Loss Days: Setting and Enforcing Hard Stops
Max Loss Days: Setting and Enforcing Hard Stops
Every professional trader has a max daily loss. Most retail traders don't. This gap is why one group makes money and the other bleeds it.
A max daily loss is simple: you decide in advance, while your head is clear, what the largest loss you can take in a single day looks like. Then you enforce it. No negotiation. No exceptions.
Setting One That Actually Works
Your max daily loss should be based on your account size and your strategy's expected drawdown profile. A common starting point: 2% of your account. On a $50K account, that's $1,000. On a $100K account, $2,000.
But the 2% figure is a starting point, not gospel. Some strategies with higher win rates and lower average losses can handle 3%. Some volatile strategies need 1% or less. The key: it should be large enough that you can take 2-3 normal losses without hitting it, but small enough that hitting it doesn't put your account in jeopardy.
Why Enforcement Beats Willpower
Setting...
Hawaii Trading: How to Prep Your Account for a Storm
Tropical Storm Lala is heading straight for the islands this weekend. Forecasters have Hawaiʻi Island under a hurricane warning, with damaging wind, dangerous surf, and up to a foot or more of rain spreading across the state from Friday into Sunday. If you trade from Hawaiʻi, this is a live risk-management drill whether you asked for one or not. So here is the Hawaiʻi Trading Academy storm-day plan: how to protect your account, and your head, when the weather takes the decision out of your hands.
Why a storm is a risk problem before it's a weather problem
Trading is already the practice of managing what you can't control. A hurricane just says it louder. You can't control Lala's track, the rain totals, or whether your neighborhood keeps power Saturday night. What you can control is your exposure before any of that happens.
The mistake is treating a storm week like a normal week with a little extra weather. It isn't. Power flickers. Internet drops. Cell towers get congested right whe...
Correlation Risk: Why Your Diversified Trades Aren't
Correlation Risk: Why Your Diversified Trades Aren't
You have three trades on: NQ long, AAPL calls, and a TQQQ position. You think you're diversified. You're not. You have one trade on, three times.
This is correlation risk. It's the invisible killer that turns a manageable losing day into a catastrophic one.
What Correlation Risk Actually Is
Correlation measures how closely two instruments move together. A correlation of 1.0 means they move in perfect lockstep. A correlation of 0 means they're independent. A correlation of -1.0 means they move in opposite directions.
NQ and ES? Correlation typically sits around 0.92-0.97. They're basically the same trade. NQ and AAPL? Around 0.85. NQ and TQQQ? Around 0.98. If you're long all three, you don't have three positions. You have one position, three times the size.
Why This Matters for Futures Traders
Say your risk model allows 2% total account risk at any given time. You put on NQ at 1% risk and ES at 1% risk. Your model says you're a...
Bad News, Good Day: Why a Weak Jobs Report Sent Stocks Up
The economy lost 23,000 jobs in July. Wall Street threw a party. The S&P 500 closed at a record 7,757, the Nasdaq jumped about 1.3%, and NQ futures ran up roughly 1.2% on the day.
If that makes no sense to you, good. It means you are paying attention. A shrinking job market should scare investors. Instead, it thrilled them. So why did stocks rip on obviously bad news?
The answer is the single most useful thing a new trader can learn about how markets actually work. It is not the number that moves price. It is what the number does to the Fed.
Wait, the economy shrank and stocks went up?
Let's set the table. Economists expected around 83,000 new jobs in July. Instead, payrolls fell by 23,000, and prior months were revised down hard. On the surface, that is a soft labor market flashing a warning.
The day before, futures markets put the odds of a September rate hike near 55%. Within minutes of the report, those odds collapsed toward zero. Traders decided the Fed now has cover to leave...
False Breakouts: Why the First Move Is Usually Bait
Friday morning handed every futures trader a free lesson. Seconds after the July jobs report hit, the Nasdaq, S&P, and gold all broke below their opening range. If you shorted that break, you felt right for about five minutes. Then price squeezed straight back up and the indices closed near their highs. NQ finished up around 1.2%.
That was a false breakout. It wasn't bad luck. It was the market doing exactly what it is built to do.
What a false breakout actually is
A false breakout is when price pushes past an obvious level, support or resistance, then snaps right back inside the range. The traders who piled in on the break are suddenly offside, and their rush to get out fuels the move against them.
Here is the part that stings. This is not rare. On lower timeframes, somewhere between half and two-thirds of intraday breakouts fail within five bars. On a one-minute chart it runs even higher. So if your default move is to buy the break or short the breakdown, the base rates are worki...
Trading Psychology: The Complacency Trap at Record Highs
The S&P 500 just printed its 25th record close of the year. NQ ran about 2,700 points in four days. If your account is green right now, here's the uncomfortable question: did you make that money because you followed your rules, or in spite of them?
Most traders never ask it. A winning streak feels like proof you finally have it figured out. That feeling is the most expensive one in this business.
Why a winning streak is more dangerous than a losing one
A losing streak gets your attention. You feel every red day. You tighten up, open your journal, and ask what's going wrong. That discomfort is useful. It keeps you honest.
A winning streak does the opposite. It's comfortable. It's quiet. And it slowly convinces you that risk management is optional. Accounts rarely blow up at the euphoric top. They blow up after a stretch of easy green days, when everyone stopped respecting the downside.
Here's the part nobody warns you about. A rally like the one we just had doesn't only pay your go...
Risk-Off Checklist: 5 Signals to Stop Trading Today
Risk-Off Checklist: 5 Signals to Stop Trading Today
Every trader has a plan for when to start trading. Almost none have a plan for when to stop. That's the problem.
Signal #1: You Hit Your Daily Max Loss
You've lost 2% of your account today. Your brain says: "Just one more trade. I can make it back." That voice is lying. Your max daily loss isn't punishment. It's architecture. Once you've hit it, you're done.
Signal #2: Two or More Revenge Trading Moments
Revenge trading is when you take a trade that doesn't fit your system because you want to make back the loss. Two revenge trades means your rational mind has checked out. The solution is stopping.
Signal #3: You've Slept Less Than 5 Hours
Sleep deprivation is a cognitive steroid for stupid decisions. Your risk tolerance skyrockets. Your impulse control bottoms out. Don't trade tired. Period.
Signal #4: Major News Event You Haven't Prepped For
When you haven't prepared for a major economic event, the odds change. Your edge rel...