Your Journal Beats Any Indicator You'll Ever Add
Traders will spend $200 a month on a new indicator, a faster data feed, or a fancier charting layout. They'll add a third oscillator to a chart that already has two. They're hunting for the tool that finally makes it click.
Here's the uncomfortable truth we've watched play out with hundreds of traders: the single tool that changes results fastest costs nothing and sits ignored on most desks. It's a trading journal.
Not because journaling reveals some secret setup. Because it's the only tool that changes your behavior, and behavior is what's actually losing you money.
Indicators Give You Information. Journals Give You Awareness.
An indicator can tell you the RSI is overbought. It cannot tell you that you always ignore your stop when you're down on the day and trying to get back to breakeven.
That second problem is costing you far more than any indicator will ever save you.
Most professional traders will tell you psychology, not strategy, is the biggest factor in long-term results....
MNQ vs NQ: Which Nasdaq Futures Contract Should a Beginner Trade?
You want to trade Nasdaq futures but there are two contracts staring at you: NQ and MNQ. Same underlying index, same price action, completely different risk profiles. Picking the wrong one for your account size is one of the fastest ways to blow up before you learn anything.
Here is the breakdown so you can make the right call.
What Are NQ and MNQ?
Both contracts track the Nasdaq-100 Index. NQ is the E-mini Nasdaq-100, the full-size contract. MNQ is the Micro E-mini Nasdaq-100, exactly one-tenth the size of NQ. They trade on the same exchange (CME), during the same hours, with the same price movement. The only difference is how much each tick and each point costs you.
Contract Specs Side by Side
NQ (E-mini): $20 per point, $5 per tick (0.25 points), initial margin roughly $18,000+.
MNQ (Micro): $2 per point, $0.50 per tick (0.25 points), initial margin roughly $1,800+.
A 50-point move on NQ = $1,000. That same 50-point move on MNQ = $100. Same chart, same candles, ten times less...
Day Trading Statistics: Why Most Traders Lose Money
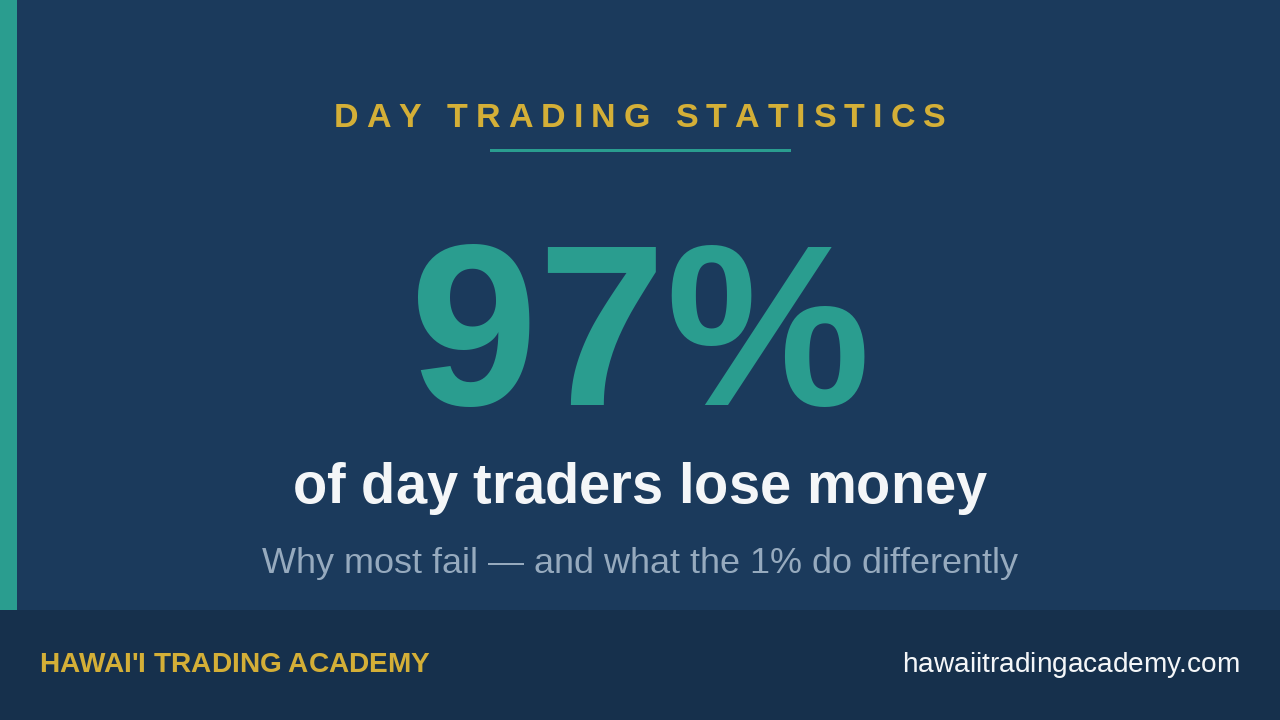
Ninety-seven percent of day traders lose money. You've probably seen that number on an ad right before someone tries to sell you a "secret" strategy. Here's the part they leave out: the stat is real, and it has almost nothing to do with strategy.
We coach traders here in Hawai'i, and we've watched smart, hardworking people light accounts on fire while sitting on a perfectly good edge. So let's actually look at the day trading statistics, figure out what they're really telling us, and talk about what the survivors do differently.
What do the day trading statistics actually say?
The data is remarkably consistent across decades and across countries.
In Brazil, researchers Chague, De-Losso, and Giovannetti tracked every single person who started day trading equity futures between 2013 and 2015. Of the traders who stuck with it for more than 300 days, 97% lost money. Only 1.1% earned more than the Brazilian minimum wage. Not "more than a doctor." More than minimum wage.
In Taiwan, Barb...
RVOL + VWAP Trading Strategy: 64% Win Rate
RVOL + VWAP Mean Reversion: 4,672 Trades and a 64% Win Rate
This is our most consistent strategy for one specific scenario: shorting overextended moves on Crude Oil.
The RVOL + VWAP Mean Reversion strategy combines relative volume analysis with VWAP deviation to find high-probability mean reversion entries. It’s Strategy 4 in our Edge Playbook, and it’s the one our students ask about most.
The Data
Across 4,672 backtested trades: Win rate: 64%. The highest of any strategy in our playbook. When you combine that with a favorable R:R, the expectancy is strong and the equity curve is smooth.
The strategy works because RVOL (Relative Volume) acts as a confirmation filter. High RVOL at VWAP deviation means institutional participation — and institutions mean revert. Low RVOL at deviation? That’s noise. Skip it.
How It Works
Setup: Price extends 1+ standard deviations from VWAP while RVOL is above 1.5x average.
Entry: First sign of reversal — a rejection candle, a momentum shift, or a ...
Best Quarter Since 2020: Does the Rally Keep Running — or Snap Back?
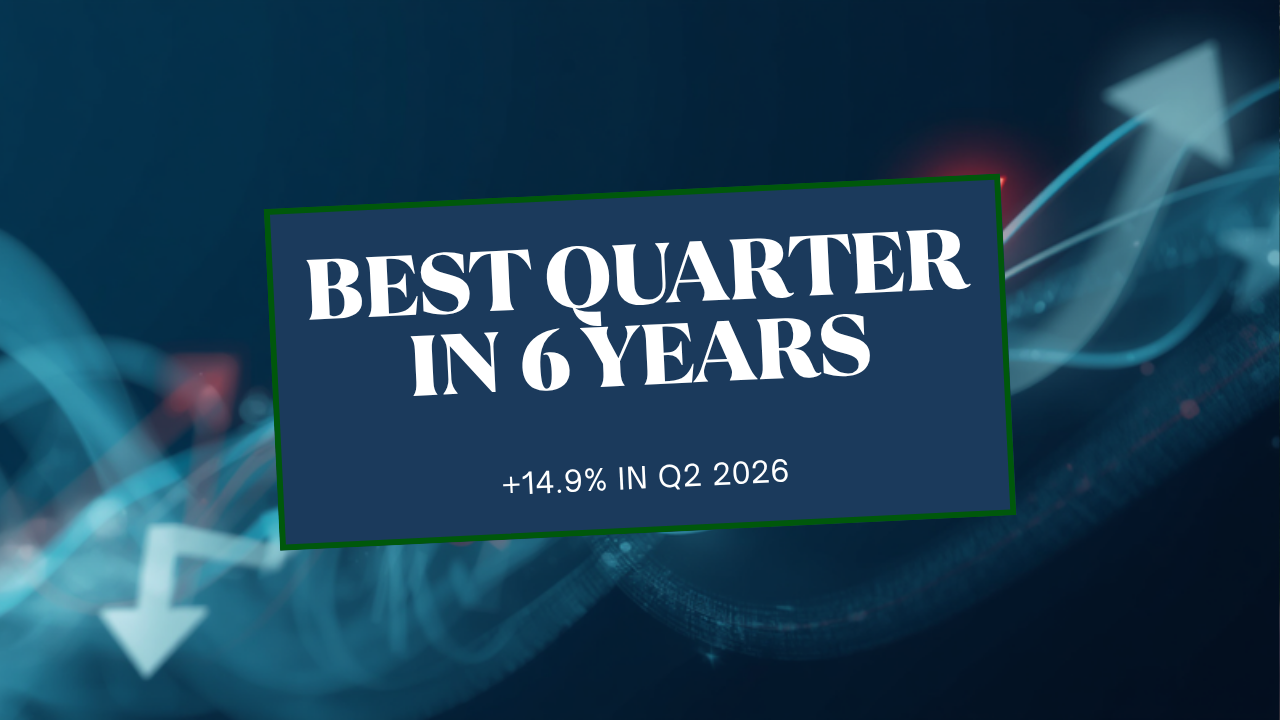
What Q2 2026's 14.9% gain actually tells you about Q3 — and what it doesn't.
Q2 2026 just closed as the strongest quarter in six years. The S&P 500 gained 14.9%. The Nasdaq ripped 21.4%. NQ futures pushed above 30,000 for the first time.
Then, on the very next session, NQ dropped 1.5%.
Right on cue, the takes started flying. Half the internet says this is the top. The other half says buy the dip, momentum is on your side.
Both camps are guessing. Here's what the data actually says — and more importantly, what it means for how you trade Q3.
What Drove Q2's +14.9%?
Three forces combined to produce the best quarter since Q2 2020:
First, earnings growth accelerated hard. S&P 500 Q2 earnings came in at +23.1% — upgraded from 18.8% at the start of the quarter. Revenue growth rose from 9.5% to 12.3%. That's not hype. That's actual profit growth supporting the move.
Second, AI spending continued to dominate. Nvidia, Microsoft, Alphabet, Amazon, and Broadcom led the charge. In the most ...
The Drawdown Reflex: Why 74% of Prop Firm Breaches Are Biological, Not Strategic
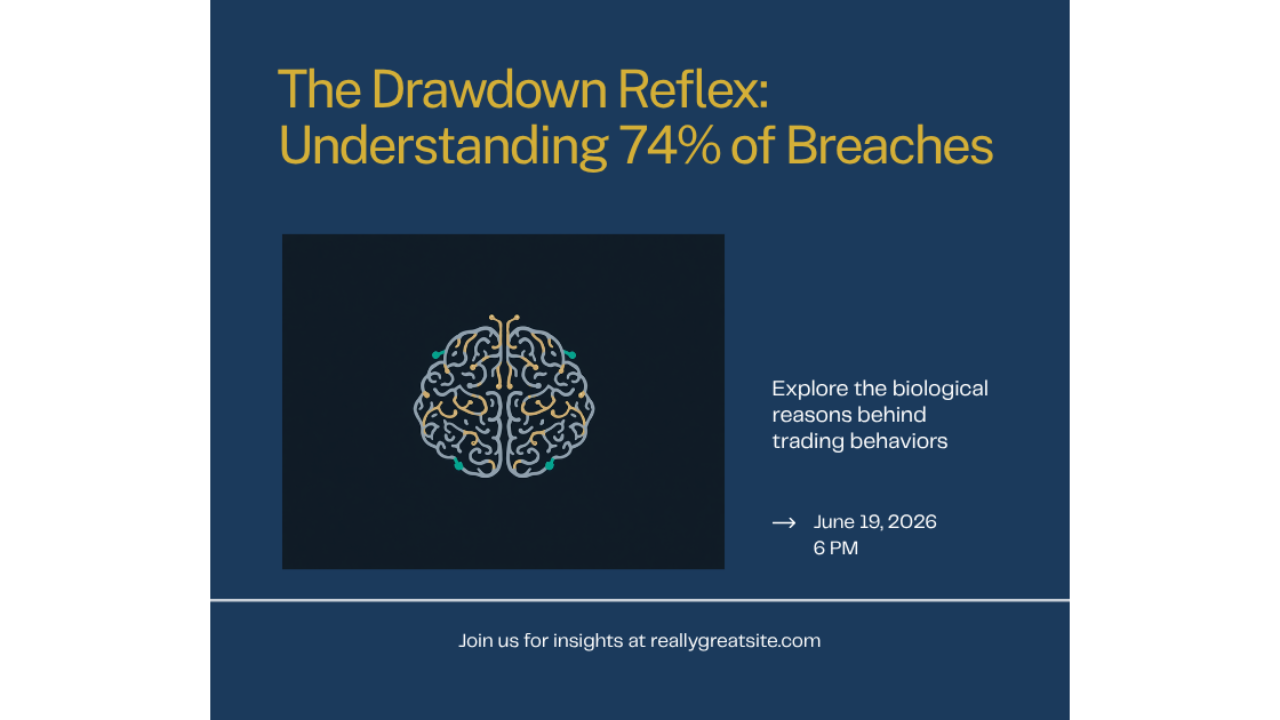
By Glenn & Reid | Hawaiʻi Trading Academy
Here's a stat that should change how you think about prop firm evaluations: roughly 74% of account breaches don't come from bad strategy. They come from a biological panic response called the drawdown reflex.
That number should bother you. Because it means most traders who fail evaluations aren't failing because their edge is broken. They're failing because their nervous system hijacks their decision-making at the worst possible moment.
If you've ever revenge-traded after a loss, cut a winner short because you were scared, or watched a position blow through your stop while your brain screamed "it'll come back" - you've met the drawdown reflex. And it's not your fault. But it is your problem to solve.
What Is the Drawdown Reflex?
When your position goes red, your amygdala treats it as a physical threat. Cortisol floods your system. Your prefrontal cortex - the part that handles logic and impulse control - goes offline. You're not making tra...
Why Gen Z Traders Are Choosing Futures Over Buy-and-Hold
The Numbers Don't Lie
Something shifted in the last five years, and the data makes it impossible to ignore.
87% of Gen Z investors put money into the markets every single month. Compare that to 68% of boomers. Almost half of Gen Z, roughly 47%, trade at least weekly. Gen X? 23%. Boomers? 15%.
14% of Gen Z day trade daily. That's twice the rate of Gen X. Gen Z now represents 40% of new retail forex accounts. And 77% of Gen Z investors started before they turned 25.
Retail futures volume is 50% higher than pre-pandemic levels. CFTC data confirms it: retail participation isn't a spike. It's structural.
This generation isn't sitting on the sidelines waiting for compound interest to do the work. They want to participate. And they're right to feel that way.
Why Passive Feels Broken to a 22-Year-Old
The "buy SPY and wait 30 years" pitch made sense when housing was affordable, wages kept up with inflation, and your parents could retire on a pension.
That world doesn't exist for most yo...
Risk Identity Framework: Fragile, Elastic, Stable
Risk Identity Framework: Are You Fragile, Elastic, or Stable?
How you handle risk isn’t just about position sizing. It’s about identity.
Our Risk Management Playbook defines three Risk Identities that determine how traders respond to adversity. Understanding which one you are is the first step to evolving.
The Fragile Trader
Fragile traders break under pressure. One bad trade, one drawdown, one unexpected gap — and the whole system collapses. They abandon strategies, blow through stops, revenge trade, and often blow accounts.
Fragile isn’t about skill. We’ve seen technically brilliant traders who are psychologically fragile. They know the setups, understand the math, but crumble when the market doesn’t cooperate.
Signs you’re fragile: You change strategies after every losing streak. Your position size varies wildly based on recent results. You have no written rules — or you have rules you consistently break.
The Elastic Trader
Elastic traders bend but don’t break. They take hit...
Vibe-Coded Trading Bots Are Losing 77x More Than Human Traders. Here's Why.
A new trend is sweeping through retail trading in 2026. Traders with zero coding experience are asking ChatGPT to write them a trading bot. They describe a strategy in plain English, the AI generates the code, and within hours they're running live capital through untested automation.
They call it "vibe coding." The results call it something else.
UC Berkeley research found that retail bot users lose 77 times more per user than human traders on the same platforms. Not 77% more. 77 times.
What Is Vibe Coding and Why Is It Everywhere?
Vibe coding is exactly what it sounds like: you describe what you want a program to do, and AI writes the code. No programming knowledge required. Business Insider profiled retail traders this month who built entire trading systems using nothing but natural language prompts.
The appeal is obvious. What used to take weeks of development now takes hours. You can go from idea to live bot in an afternoon. The algorithmic trading market hit $18.8 billion in ...
Micro E-Mini Futures: Why Smart Traders Are Sizing Down
The Volume Tells the Story
If you want to know where serious traders are putting their money, follow the volume.
In October 2025, Micro E-mini contracts accounted for 45.3% of all equity index futures volume on the CME. Not a niche product. Not training wheels. Nearly half of all equity index activity.
For the full year of 2025, Micro E-minis represented 40.5% of equity index average daily volume. The Micro E-mini Nasdaq-100 (MNQ) hit a record 1.6 million contracts per day. The Micro E-mini S&P 500 (MES) averaged 1.2 million contracts daily, up 35% year over year.
CME Group posted a total record average daily volume of 28.1 million contracts in 2025, up 6% from the prior year. And Q1 2026 shattered that with a global record of 36.2 million contracts per day, a 22% year-over-year increase.
The shift isn't subtle. The market is telling you something.
Why "Smaller" Doesn't Mean "Beginner"
There's a persistent myth in trading that micro contracts are for people who can't afford the ...