The Rules Don't Blow the Account. Your Reaction Does.
Roughly 10 to 15 percent of traders pass a futures prop firm evaluation on the first try. Ask the ones who failed what killed them and most will point at strategy — wrong setup, bad day, choppy tape.
Look at where evaluations actually die, though, and it’s almost never the strategy. It’s the drawdown breach. And a drawdown breach isn’t a strategy error. It’s an emotional one wearing a math costume.
Here’s the reframe we drill with every trader we coach through the funded path at Hawai‘i Trading Academy: the daily loss limit, the profit target, and the trailing drawdown are just numbers. They’re neutral. They don’t blow your account. What blows the account is what you do when one of those numbers gets close.
Why do the rules mess with your head?
Three rules, three specific traps.
The daily loss limit creates time pressure. You’re down for the day, the clock is ticking, and suddenly you’re forcing trades to “get it back” before the session ends. The limit didn’t make you overtrade. ...
Why You Fail the Prop Firm Eval (It's Not Your Strategy)
Ten to fifteen percent. That's about how many traders pass a futures prop firm evaluation on the first try. The other 85% mostly don't fail because their strategy was broken. They fail because they couldn't sit still.
We coach a lot of traders through the funded path at Hawai‘i Trading Academy, and the pattern is almost boring at this point. The chart is rarely the problem. The person holding the mouse is.
So what actually kills the eval?
Look at where evaluations die. Industry data from firms tracking hundreds of thousands of accounts puts roughly 70% of failures on one cause: a blown loss limit. A daily loss cap breached. A trailing drawdown tripped. Not a bad signal — a bad decision made in a bad emotional state.
That's the whole point. A drawdown breach isn't a strategy error. It's an emotional one. And emotions in an eval come in four flavors: fear, greed, hope, and regret. Each one breaks a different rule.
Fear makes you trade like the account is on fire
Fear shows up as he...
The 2% Rule Is Wrong: How to Size for YOUR Account
The 2% Rule Is Wrong: How to Size for YOUR Account
You've heard it before: never risk more than 2% of your account on a single trade. The problem? It's generic. It works for nobody in particular.
The 2% rule is a starting point, not a destination. Your real position size depends on four things: account size, strategy type, your actual win rate, and your psychological tolerance for drawdown.
Account Size Changes Everything
Say you have a $10,000 account and you trade a strategy that averages 50 pips on ES futures. At 2% risk, you're risking $200 per trade. That's 4 pips. Good luck executing that without slippage eating you alive.
Now say you have a $100,000 account. 2% is $2,000. That's 40 pips of wiggle room. The 2% rule doesn't account for the minimum viable risk unit in YOUR market.
Strategy Type Demands Different Sizing
Mean reversion? Tight stops, quick exits, low win rate (40-50%), but high reward-to-risk. You can size more aggressively. Breakout trading? Wider stops, longe...
The 31% Number
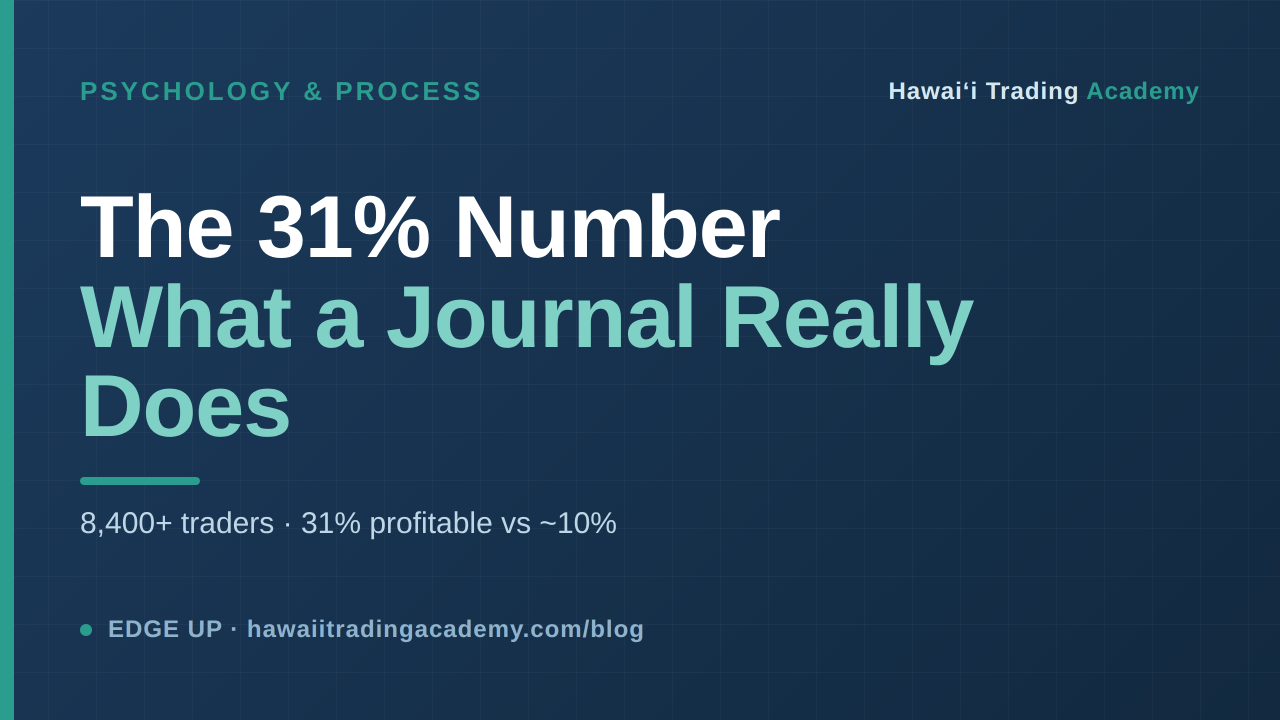
Here's a stat that sounds like a sales pitch: traders who journal for 90+ days are 31% net profitable, versus a roughly 10% baseline for retail. Triple the odds. Just journal.
We're not going to tell you that. Because it's wrong.
The number is real — a 2026 cohort of more than 8,400 active traders who logged 90-plus days of trades came in around 31% net profitable. But the lazy read of that stat — "journaling makes you profitable" — confuses correlation with causation, and if you build your trading on that misread you'll be disappointed and broke.
What the 31% number actually says
Journaling doesn't cause profitability. It self-selects for it.
Think about who logs 90 straight days of trades. Not the impulsive gambler. Not the revenge trader who blows up in week three. The person who journals for three months without missing was already the kind of person who would survive — disciplined, honest with themselves, willing to look at losses instead of hiding them. The journal didn't bu...
Trade Like a Business: Mark Douglas's Five Truths
A losing trade is a business expense. Read that again, because your gut hates it.
Your gut wants the loss to mean something, that you were wrong, that the market cheated you, that you need to make it back right now. That reaction feels like accountability. It’s actually the most expensive instinct in trading, and it’s the reason the trade after a loss is so often the worst one you take.
There’s a fix that’s almost thirty years old and still undefeated. Mark Douglas laid out five fundamental truths in Trading in the Zone, and a 2026 audit of funded traders found the ones who reviewed those truths consistently held a 22% higher Sharpe ratio than those who didn’t. Same charts. Same strategies. Different relationship with uncertainty.
We lean on this framework hard at Hawai’i Trading Academy, because psychology is the pillar most traders skip and the one that actually decides who survives.
What are Mark Douglas’s five truths?
They sound simple. They’re not easy. Here they are, plain:
...Read the Rules Before the Print
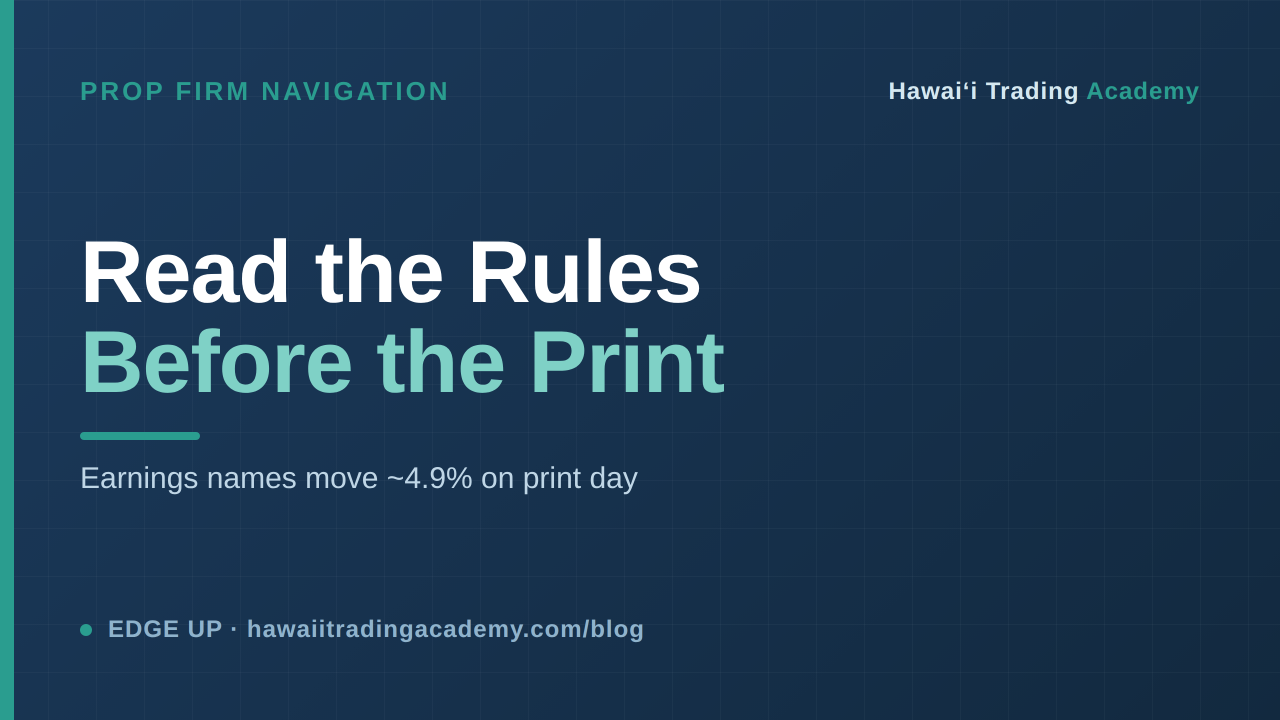
Alphabet and Tesla report Wednesday. Here's a question most funded traders can't answer until it's too late: does your prop firm allow you to hold through it?
A lot of traders find out the answer after the violation email. And in a week stacked with earnings — with the Fed decision landing July 28-29 right behind it — that's an expensive time to be learning your own firm's rulebook.
This post isn't about which way Alphabet moves. It's about the two things that actually decide whether you keep your funded account through an event week: knowing the rules before the print, and building a sizing process that doesn't care what the rules are.
Earnings day is a coin flip with your size on it
Start with the number. The average S&P 500 name moved 4.9% — in absolute terms — on its earnings day in Q1 2026. That's three to five times a normal session. And July volume is thin, which amplifies the swing.
Holding a position through a print is not a trade. It's a bet on a 4.9% coin flip, and the ...
1% Weekly Beats 10% Daily: The Math of Sustainable Trading

The Long Game: Why 1% Per Week Beats 10% Per Day
November 2026
The boring path is the profitable path. And the math proves it.
Every trader talks about making 10% in a day. The traders who tried that are gone. They blew accounts. They quit. Meanwhile, the traders who aimed for 1% per week are still trading five years later with multimillion dollar careers. This is not motivational. This is math.
The Math of 1% Per Week
1% per week = 52% per year, compounded. That's 67% annualized compound growth. On a $50K account, that's $83,500 in one year. By year three, $235,000. By year five, you've crossed $500K. The timeline is boring. The outcome is not.
But here's the part most traders miss: 1% per week assumes you don't blow up. That's the real edge. The math only works if you survive.
Why 10% Per Day Fails
10% per day requires perfect execution 20 times in a row. At 60% win rate, the probability of 20 consecutive trades without a major drawdown is 0.6^20 = 0.000036. That's 1 in 27,00...
Prop Firm Rules 2026: What Every Funded NQ Trader Must Know
Three rules quietly changed across the futures prop firm industry this year. Most funded traders haven't noticed. Then their first decent payout request gets flagged, the account gets paused, and they're stuck reading fine print that didn't exist 12 months ago.
We've been fielding the same questions from students all spring: Is my firm still safe? Why did my eval get reviewed? What's a B-Book? So we're putting the answers in one place — minus the affiliate hype most prop firm content runs on.
If you trade NQ or MNQ for a funded account in 2026, three things matter. Here they are.
What Actually Changed in 2026
The three shifts are connected, even though firms rolled them out separately:
- Execution venue disclosure. Firms now have to state, in writing, whether your trades route to a live exchange (the CME) or get processed through an internal simulator (B-Book).
- Lot-size consistency rules. Most top-tier firms now flag trades that are 2x or 3x larger than your trailing-average posi ...
Revenge Trading: The 22% Win Rate and the 30-Minute Fix
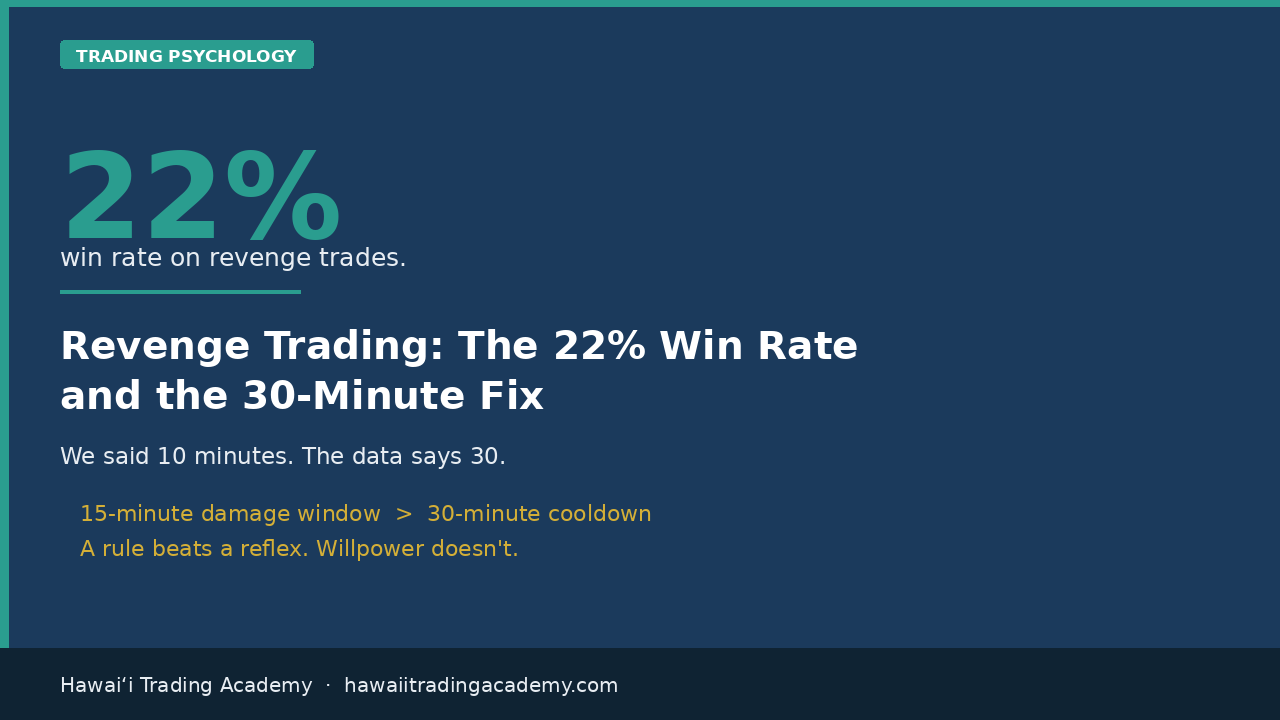
We told you to wait 10 minutes. The data says that is not long enough.
Earlier this month we published a piece on the drawdown reflex, the biological panic response behind roughly 74% of prop firm breaches. In it we gave you a rule: after any loss, wait 10 minutes before entering a new trade. Let the cortisol drop. Let your prefrontal cortex come back online.
That rule was directionally right. The number was wrong. Here is what the revenge trading data changed about our thinking.
What does the revenge trading data actually show?
Revenge trading has a measurable signature. In journal data it shows up as a specific, identifiable trade: an entry placed within 15 minutes of a loss, at larger than normal size.
Filter for those two conditions and the numbers are ugly. Those trades won 22% of the time.
Sit with that for a second. Your strategy might win 55%, 60%, 65%. Our RVOL + VWAP mean reversion setup wins 64% across 4,672 backtested trades. The same trader, on the same day, trading ...
Psychological Operating System: 5 Components
The Psychological Operating System: 5 Components Every Trader Needs
October 2026
You don't need mental toughness. You need architecture. A system that runs when your brain is fried.
Every trader talks about discipline like it's willpower. It's not. Willpower is a depleted resource. You wake up with 100 units of it. By lunch you're down to 30. By day three of a losing streak you're at five. Then you crack. That's not weakness. That's biology.
The traders who last are the ones who stopped relying on willpower. They built systems that run automatically. Five components. Each one executes whether you feel sharp or not. This is your psychological operating system.
Component 1: Pre-Session Protocol
Before you look at a single chart, you run your protocol. Same every trading day. Same checklist. Same journal entry. Same setup. This removes decision fatigue before you even think about a trade.
The specifics don't matter. The consistency does. Your protocol primes your brain for executio...