The SpaceX IPO Just Broke Records. Here's What NQ Traders Need to Know.
SpaceX went public on June 12, 2026. SPCX opened at $150, closed at $161, and finished the day up 19%. Largest IPO in stock market history. $2.2 trillion market cap on day one.
If you trade NQ futures, this matters. Not because of the hype. Because of the mechanics behind it.
The SpaceX IPO triggered a capital rotation event that will ripple through Nasdaq-100 constituents for weeks. If you don't understand how that works, you're trading blind in a structurally different market.
What Actually Happened on June 12?
SpaceX raised $75 billion by selling 556.6 million shares at $135 each. The stock listed on Nasdaq under the ticker SPCX. By close, the market cap hit $2.2 trillion - putting SpaceX alongside Nvidia, Apple, Alphabet, Microsoft, and Amazon as one of only six U.S. companies to cross that threshold.
That's the headline. The part that matters for futures traders is what happened underneath.
Investors needed cash to buy SPCX. Where did that cash come from? They sold existing ...
4 Stages of Trading Tilt: Catch It Before You Blow Up
The 4 Stages of Trading Tilt
Tilt isn’t an on/off switch. It’s a progression.
Stage 1: The Trigger
Something goes wrong. An unexpected stop-out. At Stage 1, you’re still rational. Circuit breaker: Pause 90 seconds after any unexpected loss.
Stage 2: The Simmer
Frustration builds quietly. Your criteria loosen. Circuit breaker: Rate every setup A/B/C. Two consecutive B or lower? Stop for the session.
Stage 3: The Escalation
Fully tilted. Sizing up. Moving stops. This is where accounts blow up. Circuit breaker: Drawdown Throttle. Down 2%? Size cuts. Down 3%? Done.
Stage 4: The Aftermath
Guilt, shame, self-criticism. Circuit breaker: Post-session debrief. Diagnose, don’t judge.
Emergency Protocol
Stop. Close all positions. Close the platform. Leave the room.
Free Resource: Download the HTA Trading eBook — The foundation every consistent trader needs, from risk management to trading psychology.
Mahalo for reading and trade well! — Glenn & Reid | Hawai’i Trading Academy
Fre
...How to Trade NFP Futures: Lessons from May 2026's Shock Report
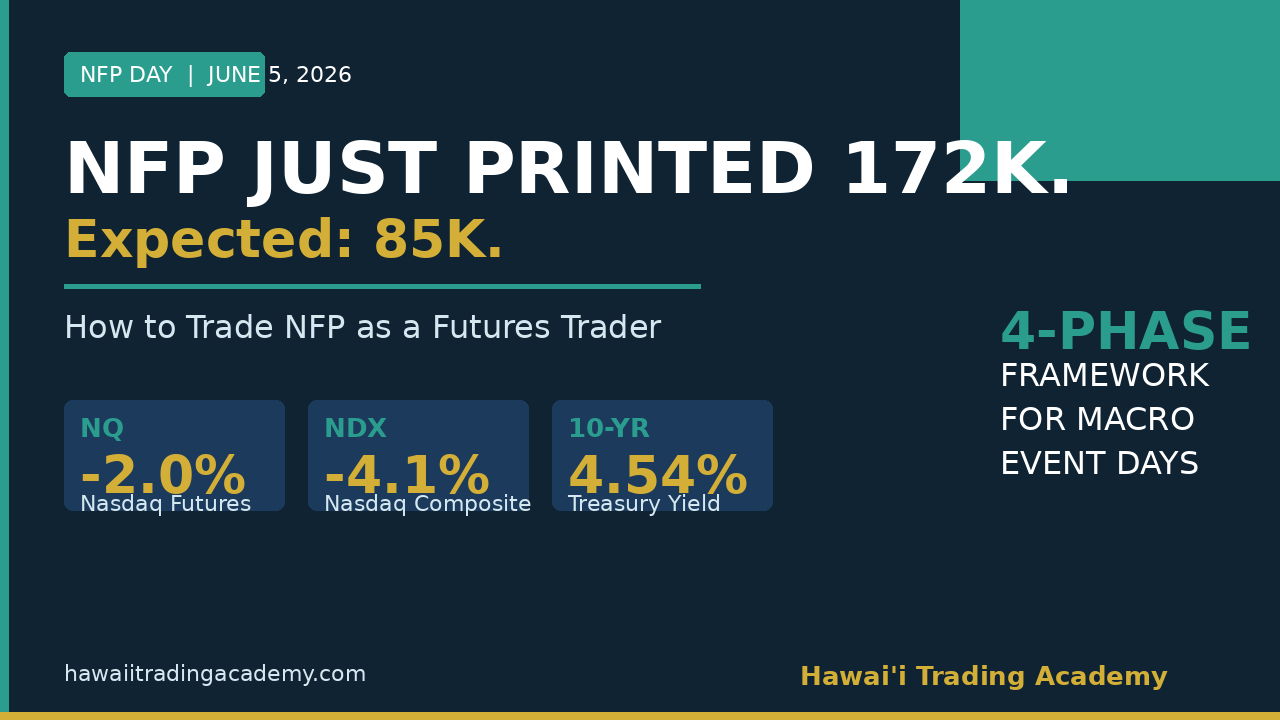
This morning, the May 2026 jobs report printed 172,000 new jobs. The consensus was 85,000.
That's not a miss. That's a near-2x beat on one of the most market-moving data releases of the month.
By the open, the Nasdaq composite was down 4.1%. NQ futures were off nearly 2%. Nvidia dropped 6%. And the 10-year Treasury yield spiked to 4.54% as traders repriced Fed rate hike odds from 50% to 57% overnight.
If you didn't have a plan before 8:30 AM ET today, the market made the decisions for you. This post is about not letting that happen again.
Why Does a Good Jobs Number Tank the Nasdaq?
Before we get into the framework, let's make sure the "why" is clear - because a lot of newer traders are staring at their screens right now confused about why strong employment data would cause a selloff.
Here's the logic: Strong jobs = wage pressure = sticky inflation = Fed keeps rates higher longer = bad for growth stocks = NQ leads the way down.
When 10-year yields jump - they hit 4.54% today - t...
Trading Journal as Psychology Tool: Track Emotions, Not Just P&L
Your Trading Journal Is a Psychology Tool, Not a Scoreboard
Most traders journal wrong. They log entries, exits, P&L, and maybe a chart screenshot. Then they never look at it again.
That’s not journaling. That’s bookkeeping. And bookkeeping doesn’t make you a better trader.
In our Psychology Playbook, the journal is the most powerful tool in your arsenal — but only if you use it to track emotions and behavior, not just numbers.
The 5 Fields That Actually Matter
Beyond the standard entry/exit/P&L, we require five psychology fields in every journal entry:
1. Emotional state at entry. One word. Calm? Anxious? Bored? Excited? Frustrated? This single data point, tracked over 30+ trades, reveals patterns you can’t see in real time.
2. Emotional state at exit. Did it change? If you entered calm and exited panicked, that tells you something about how you handle drawdowns.
3. Setup quality rating (A/B/C). Was this a textbook setup or a “close enough”? Be honest. Over time, you’ll see th...
Keltner Channel Breakout Strategy: 302 Trades, $564K P&L
Keltner Channel Breakout: 302 Trades, $564K, and the Highest R:R in Our Playbook
If you want proof that patience pays, this is the strategy.
The Keltner Channel Breakout is Strategy 3 in our Edge Playbook. Only 302 trades across our backtesting period. Far fewer signals than our mean reversion strategies. But when it fires, the numbers are extraordinary.
The Numbers
Across 302 backtested trades on Gold futures (GC), 1-hour timeframe:
Win rate: 51.3%. Just above coin-flip.
Risk-to-Reward: 7.8:1. That’s not a typo. Winners averaged 7.8 times the size of losers.
Gross P&L: $564,000. On 302 trades.
This strategy trades infrequently but swings hard when it does. It’s the opposite of a scalping approach — low frequency, high impact.
How Does It Work?
Keltner Channels use ATR (Average True Range) to create dynamic bands around a moving average. When price breaks outside the channel with volume confirmation, it signals a potential trend move — not a mean reversion.
Entry: Price clos...
Your Trading Journal Is Worth More Than Any Indicator
Here's something most traders in Hawai'i - and everywhere else - won't hear from the YouTube algorithm: the tool that will improve your trading the most isn't a custom indicator, a proprietary scanner, or some magic moving average crossover. It's a journal.
Not a fancy one. Not an expensive one. Just a consistent habit of writing down what you did, why you did it, and how you felt when you did it.
We (Glenn & Reid) have coached hundreds of traders through our Net Alpha program, and the pattern is always the same: traders who journal consistently improve faster than those who don't. Period. No exceptions in our experience.
Why Does Every Struggling Trader Reach for Another Indicator?
Because it feels productive. You download a new oscillator, tweak the settings, overlay it on your NQ chart, and suddenly you feel like you're doing something. It scratches the itch without requiring the uncomfortable work of self-examination.
Trading from Hawai'i, we get this. Reid is up at 3:30 AM HS...
5 Emotional Enemies Every Trader Faces (And How to Win)
The 5 Emotional Enemies Every Trader Faces (And How to Beat Them)
One of our students texted me last week: “Reid, I know the strategy works. I’ve backtested it. But when I’m live, it’s like a different person takes over.”
He’s not wrong. In our Psychology Playbook, we’ve identified the five emotional enemies that hijack live trading.
Enemy #1: Fear
Fear of loss. Fear of being wrong. Fear of missing out. Fear makes you exit winners too early, skip valid setups, and freeze when you should be acting.
The antidote isn’t courage — it’s confidence in your data. When you’ve backtested 2,052 trades and the expectancy is positive, fear has less room to operate.
Enemy #2: Greed
Greed overrides your pre-planned exits and turns winning trades into losers. The fix: Pre-set targets in the platform. Define your exit before you enter.
Enemy #3: Hope
You’re down on a trade. It’s hit your stop level. But instead of executing, you move the stop and think: “It’ll come back.” Hope is not a trading...
Oil Swings $40 in Weeks — What the Hormuz Crisis Teaches About Your Trading Process
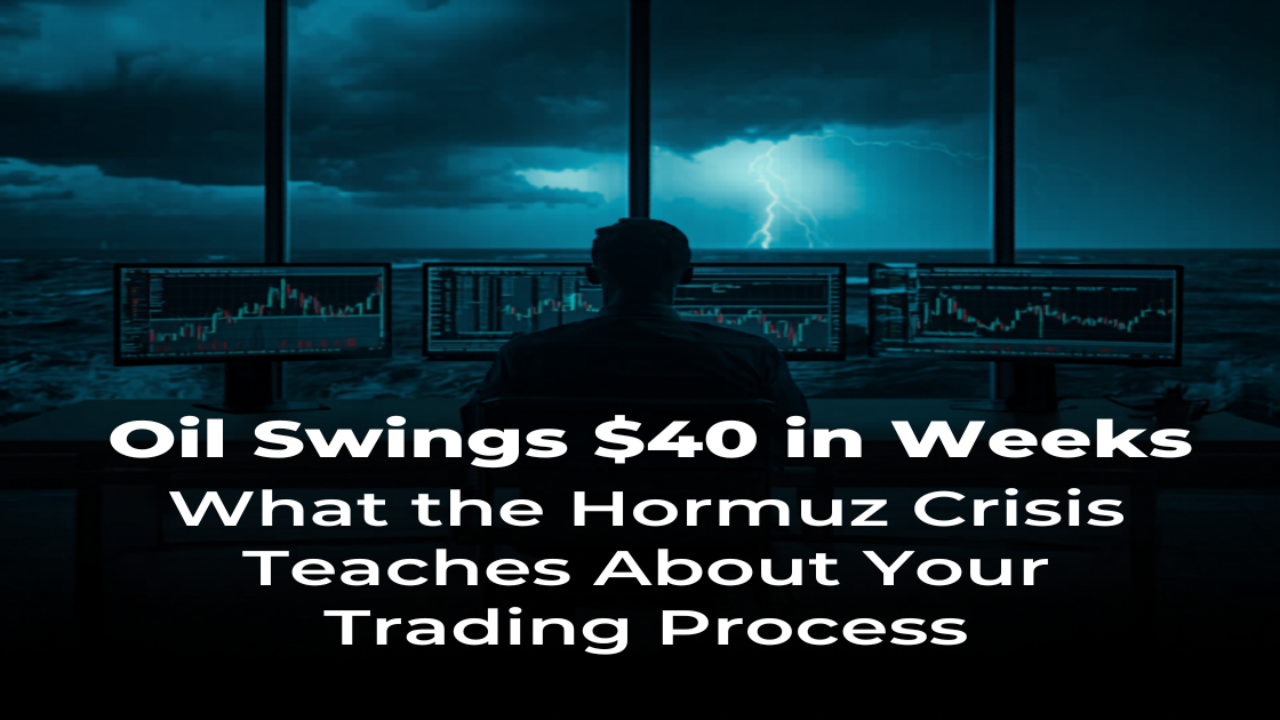
If your risk plan only works when markets are calm, you don’t have a risk plan. You have a wish.
The Strait of Hormuz crisis has been the defining macro event of 2026. Since February, oil prices have swung from above $144 a barrel to below $100, then back to $110+. The IEA called it the largest supply disruption in the history of the global oil market. And if you trade NQ futures, you felt every ripple — because when oil goes haywire, risk sentiment follows.
This isn’t a geopolitics lesson. We’re not here to break down foreign policy. We’re here to talk about what this kind of event reveals about your process — and whether it held up or fell apart.
Why NQ Traders Need to Care About Oil
NQ doesn’t trade oil. But NQ trades sentiment, and sentiment this year has been hostage to Hormuz headlines.
Here’s the pattern we’ve seen since February: A headline drops about deal progress between the US and Iran. Oil dips. Risk-on flows spike. NQ gaps up. Then 48 hours later, negotiations stall....
Day Trading Classes in Hawaiʻi: What to Look For (And What to Run From)
You typed "day trading classes near me" into Google at 11 PM, didn't you? Probably after watching a reel of some guy flashing a P&L screenshot from his lambo. We get it. But here's the thing — that search might be the most important financial decision you make this year. Pick the right class and you compress years of painful lessons into months. Pick the wrong one and you're out $5K with nothing but a Discord invite and a lot of regret.
We've been trading futures from Hawaiʻi for over 15 years and coaching traders through Hawaiʻi Trading Academy. We've seen every flavor of trading education — the good, the terrible, and the "why did I give them my credit card" variety. Here's what actually matters when you're evaluating trading classes, whether you're in Honolulu or anywhere else.
Do They Actually Trade?
This is the single biggest filter. Most trading "educators" stopped trading years ago because selling courses is easier than managing risk every morning at 3:30 AM HST. Ask yourself...
Bollinger Band Mean Reversion: 1,180 Trades, 3.55 R:R
Bollinger Band Mean Reversion: 1,180 Trades and a 3.55 R:R
Most people use Bollinger Bands wrong. They see price touch the outer band and think: “breakout!” The data says otherwise. Over 1,180 backtested trades, the highest-expectancy play isn’t the breakout. It’s the snap-back.
Bollinger Band Mean Reversion is one of the five core strategies in our Edge Playbook, and it carries the highest R:R of any strategy we teach.
What Does the Data Say?
Across 1,180 trades in our TrendSpider backtesting:
Win rate: 49.3%. Less than a coin flip. But win rate is only half the equation.
Risk-to-Reward: 3.55. When this strategy wins, it wins big.
Expectancy: +1.243R per trade. Every trade, on average, returns 1.24 times your risk.
Why Does a Sub-50% Win Rate Strategy Work?
Because expectancy is what matters, not win rate. A strategy that wins 49% of the time but makes 3.55x on winners is massively profitable over a large sample.
The psychological challenge: you’ll lose more often than you w...