Best Quarter Since 2020: Does the Rally Keep Running — or Snap Back?
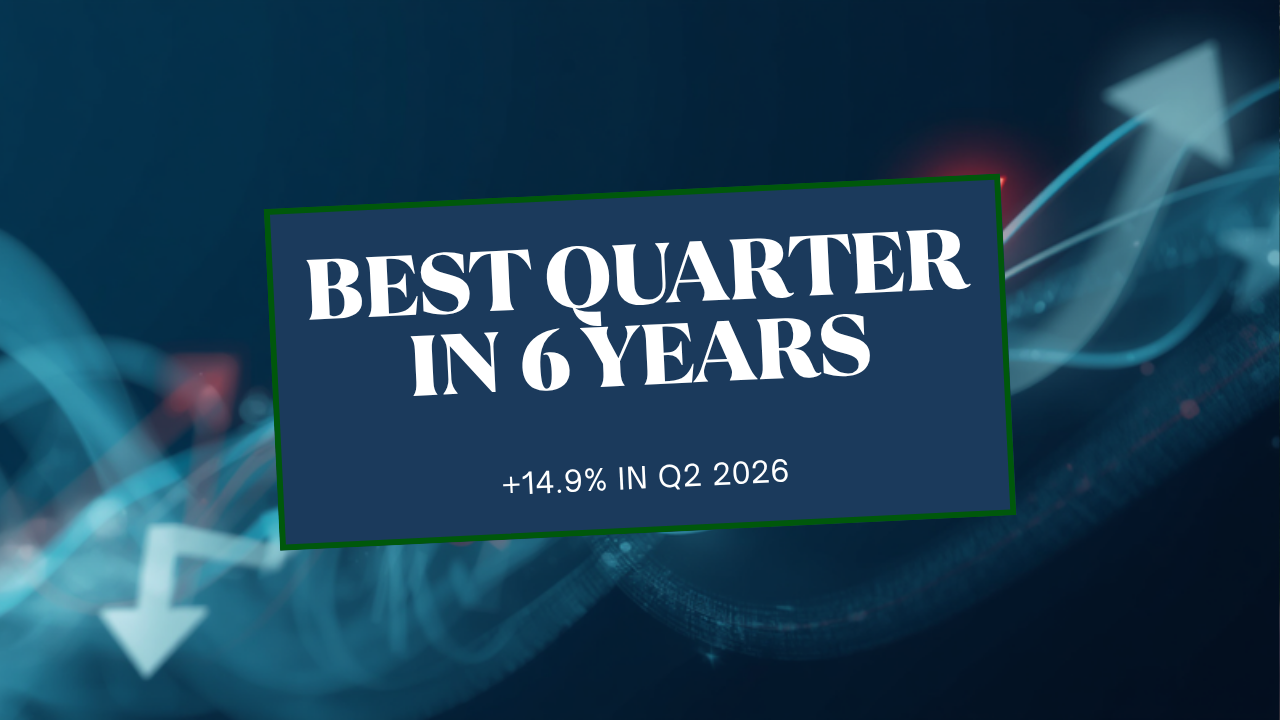
What Q2 2026's 14.9% gain actually tells you about Q3 — and what it doesn't.
Q2 2026 just closed as the strongest quarter in six years. The S&P 500 gained 14.9%. The Nasdaq ripped 21.4%. NQ futures pushed above 30,000 for the first time.
Then, on the very next session, NQ dropped 1.5%.
Right on cue, the takes started flying. Half the internet says this is the top. The other half says buy the dip, momentum is on your side.
Both camps are guessing. Here's what the data actually says — and more importantly, what it means for how you trade Q3.
What Drove Q2's +14.9%?
Three forces combined to produce the best quarter since Q2 2020:
First, earnings growth accelerated hard. S&P 500 Q2 earnings came in at +23.1% — upgraded from 18.8% at the start of the quarter. Revenue growth rose from 9.5% to 12.3%. That's not hype. That's actual profit growth supporting the move.
Second, AI spending continued to dominate. Nvidia, Microsoft, Alphabet, Amazon, and Broadcom led the charge. In the most ...
The Drawdown Reflex: Why 74% of Prop Firm Breaches Are Biological, Not Strategic
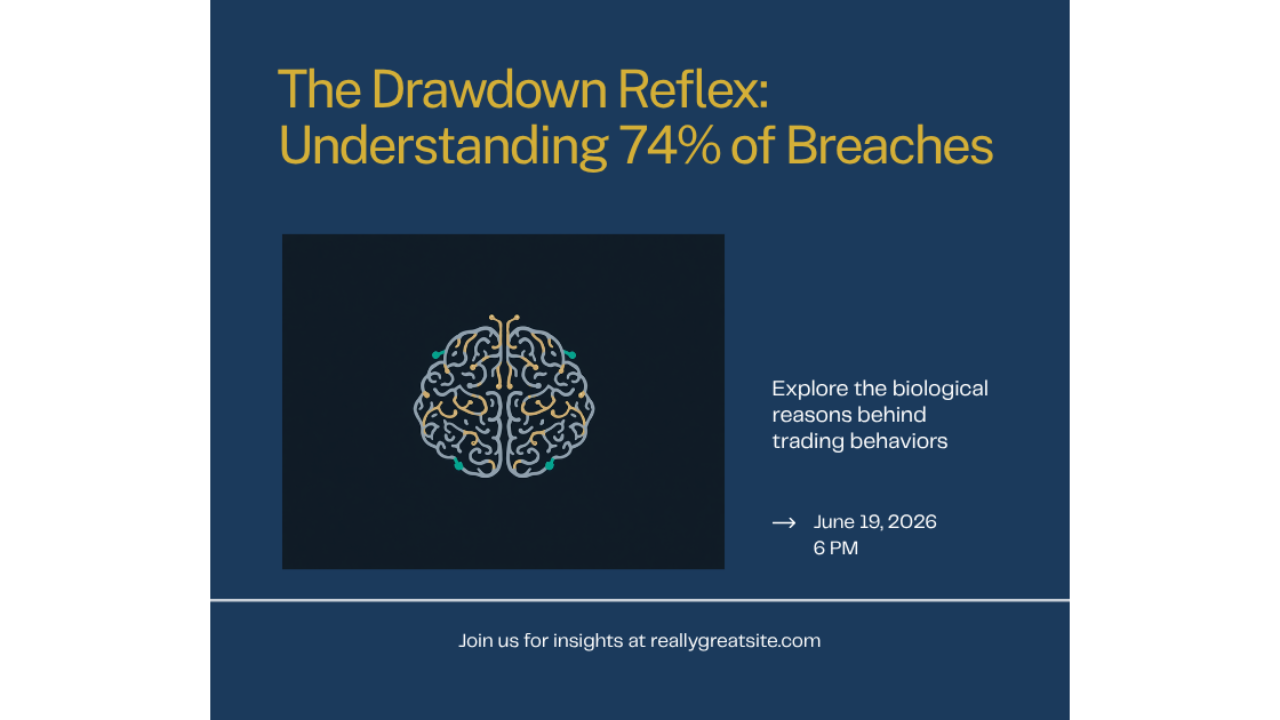
By Glenn & Reid | Hawaiʻi Trading Academy
Here's a stat that should change how you think about prop firm evaluations: roughly 74% of account breaches don't come from bad strategy. They come from a biological panic response called the drawdown reflex.
That number should bother you. Because it means most traders who fail evaluations aren't failing because their edge is broken. They're failing because their nervous system hijacks their decision-making at the worst possible moment.
If you've ever revenge-traded after a loss, cut a winner short because you were scared, or watched a position blow through your stop while your brain screamed "it'll come back" - you've met the drawdown reflex. And it's not your fault. But it is your problem to solve.
What Is the Drawdown Reflex?
When your position goes red, your amygdala treats it as a physical threat. Cortisol floods your system. Your prefrontal cortex - the part that handles logic and impulse control - goes offline. You're not making tra...
Why Gen Z Traders Are Choosing Futures Over Buy-and-Hold
The Numbers Don't Lie
Something shifted in the last five years, and the data makes it impossible to ignore.
87% of Gen Z investors put money into the markets every single month. Compare that to 68% of boomers. Almost half of Gen Z, roughly 47%, trade at least weekly. Gen X? 23%. Boomers? 15%.
14% of Gen Z day trade daily. That's twice the rate of Gen X. Gen Z now represents 40% of new retail forex accounts. And 77% of Gen Z investors started before they turned 25.
Retail futures volume is 50% higher than pre-pandemic levels. CFTC data confirms it: retail participation isn't a spike. It's structural.
This generation isn't sitting on the sidelines waiting for compound interest to do the work. They want to participate. And they're right to feel that way.
Why Passive Feels Broken to a 22-Year-Old
The "buy SPY and wait 30 years" pitch made sense when housing was affordable, wages kept up with inflation, and your parents could retire on a pension.
That world doesn't exist for most yo...
Risk Identity Framework: Fragile, Elastic, Stable
Risk Identity Framework: Are You Fragile, Elastic, or Stable?
How you handle risk isn’t just about position sizing. It’s about identity.
Our Risk Management Playbook defines three Risk Identities that determine how traders respond to adversity. Understanding which one you are is the first step to evolving.
The Fragile Trader
Fragile traders break under pressure. One bad trade, one drawdown, one unexpected gap — and the whole system collapses. They abandon strategies, blow through stops, revenge trade, and often blow accounts.
Fragile isn’t about skill. We’ve seen technically brilliant traders who are psychologically fragile. They know the setups, understand the math, but crumble when the market doesn’t cooperate.
Signs you’re fragile: You change strategies after every losing streak. Your position size varies wildly based on recent results. You have no written rules — or you have rules you consistently break.
The Elastic Trader
Elastic traders bend but don’t break. They take hit...
Micro E-Mini Futures: Why Smart Traders Are Sizing Down
The Volume Tells the Story
If you want to know where serious traders are putting their money, follow the volume.
In October 2025, Micro E-mini contracts accounted for 45.3% of all equity index futures volume on the CME. Not a niche product. Not training wheels. Nearly half of all equity index activity.
For the full year of 2025, Micro E-minis represented 40.5% of equity index average daily volume. The Micro E-mini Nasdaq-100 (MNQ) hit a record 1.6 million contracts per day. The Micro E-mini S&P 500 (MES) averaged 1.2 million contracts daily, up 35% year over year.
CME Group posted a total record average daily volume of 28.1 million contracts in 2025, up 6% from the prior year. And Q1 2026 shattered that with a global record of 36.2 million contracts per day, a 22% year-over-year increase.
The shift isn't subtle. The market is telling you something.
Why "Smaller" Doesn't Mean "Beginner"
There's a persistent myth in trading that micro contracts are for people who can't afford the ...
Prop Firms Are Dying — Here's How to Pick One That Won't
Five to eight futures prop firms are closing, rebranding, or getting absorbed every single quarter in 2026. If you're paying evaluation fees without vetting the firm first, you're gambling before you even place a trade.
This isn't fear-mongering. It's the reality of an industry going through a hard consolidation. The firms that survive will be the ones that treat traders like partners, not like ATM machines. And the traders who survive will be the ones who pick their firms the way they pick their trades — with data, not hype.
Why the Prop Firm Shakeout Is Happening Now
The numbers tell the story. Search volume for prop firms exploded 55x between 2020 and 2026. That growth attracted two types of firms: those building sustainable businesses, and those farming evaluation fees with no intention of paying out consistently.
The second group is getting exposed. FundingTicks recently changed their trading rules retroactively — meaning traders who were playing by the rules suddenly weren't....
KOSPI Crashes 10%: Contagion Lessons for Futures Traders
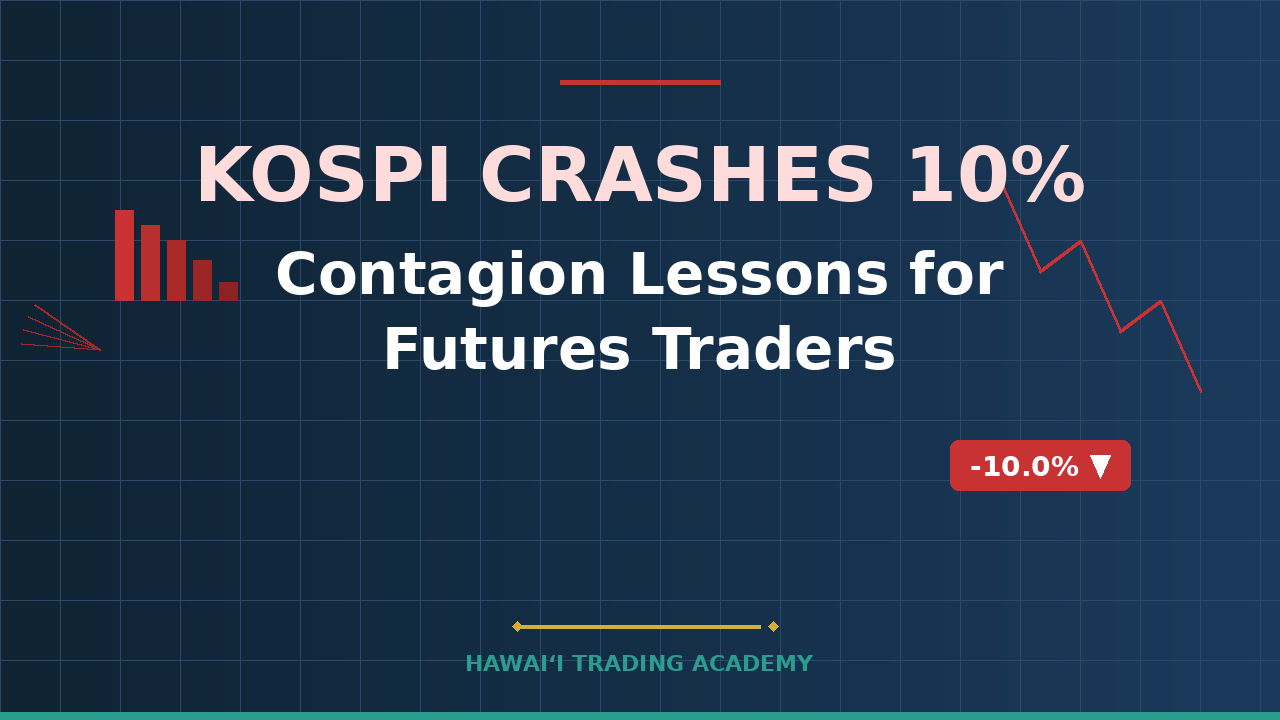
"Diversification" didn't save South Korea's stock market. Two stocks made up half the index. On Tuesday, that was the problem.
The KOSPI dropped 9.99% on June 23, 2026. Circuit breakers triggered. Trading halted for 20 minutes. Samsung fell 12.3%. SK Hynix fell 12.5%. Foreign investors dumped $3.8 billion in a single session.
If you think this only matters to Korean equity traders, think again. NQ futures dropped 3.29% the same day. The contagion was already in your chart.
What Actually Happened
Two companies -- Samsung and SK Hynix -- make up roughly 48% of the KOSPI's total market value. They contributed about 70% of the index's 2026 gains.
When the global semiconductor selloff hit, those two stocks didn't just fall. They dragged the entire Korean market with them. A "diversified" index lost nearly 10% because it was secretly a two-stock bet.
The trigger was the overnight U.S. tech selloff, amplified by Bank of America raising rate hike concerns and MSCI declining to add South ...
NQ Drops 3.29%: What the AI Chip Selloff Teaches About Risk
What separates the traders who survived Tuesday's semiconductor bloodbath from the ones who blew their accounts?
The Nasdaq dropped 578 points on June 23. Nvidia fell 4.15%. Micron cratered 13%. Over $1.3 trillion vanished from the global chip sector in a single session.
If you were long NQ futures without a stop, you felt every tick of that.
What Actually Happened
Broadcom missed its Q3 AI chip sales guidance -- $16 billion vs. the $17.2 billion analysts expected. That gap was less than 7%. But in a market priced for perfection, "meeting expectations" reads as a sell signal.
The selling cascaded. ARM, Marvell, Analog Devices, Western Digital, Qualcomm -- all down 9% or more. The semiconductor index fell 7.9%. NQ futures dropped 3.29% in a single session.
The narrative shifted from "AI will eat the world" to "are we in a bubble?" in about six hours.
Why This Matters for Futures Traders
We've seen this pattern before. A momentum trade gets crowded. The thesis is "obvious." Every...
Why Most Traders Lose Money (And What Actually Fixes It)
Here's a number that should make you uncomfortable: somewhere between 74% and 89% of retail traders lose money. That range comes from broker disclosures, FINRA reports, and academic studies spanning over a decade. The exact number depends on the asset class and time horizon, but the direction never changes.
Most traders already know this. They've read it in every "top 10 trading tips" article on the internet. And then they do the same thing everyone else does - they go looking for a better strategy.
That's the wrong move.
What Does the Data Actually Say?
A 2019 study out of Brazil tracked 19,646 day traders over two years. 97% of them lost money after 300 days. Not "didn't beat the market" - lost money. The ones who stuck around long enough to be profitable? They made an average of $310 per day. The median was closer to $54.
FINRA data shows 72% of day traders ended their most recent year with financial losses. And more than 75% quit within two years.
Those numbers look like a st...
5 Types of Stop Losses: When to Use Each One
5 Types of Stop Losses and When to Use Each One
Not all stops are created equal. Most traders use one type — the hard stop — and ignore the other four. That’s like owning a toolbox with only a hammer.
Our Risk Management Playbook defines five stop types, each designed for different market conditions and trade setups.
1. Hard Stop
A fixed price level entered at trade entry. Non-negotiable. The platform executes it regardless of your emotions. This is your default — every trade should have one.
When to use: Always. Every single trade. No exceptions.
2. Structural Stop
Placed based on market structure — below support, above resistance, beyond a key level. The logic: if price reaches this level, your thesis is invalidated.
When to use: Mean reversion trades where specific levels define the trade thesis.
3. Trailing Stop
Moves with price as the trade goes in your favor. Locks in profits while giving the trade room to run. We use 3x ATR trails in our breakout strategies.
When to u...