Keltner Channel Breakout Strategy: 302 Trades, $564K P&L
Keltner Channel Breakout: 302 Trades, $564K, and the Highest R:R in Our Playbook
If you want proof that patience pays, this is the strategy.
The Keltner Channel Breakout is Strategy 3 in our Edge Playbook. Only 302 trades across our backtesting period. Far fewer signals than our mean reversion strategies. But when it fires, the numbers are extraordinary.
The Numbers
Across 302 backtested trades on Gold futures (GC), 1-hour timeframe:
Win rate: 51.3%. Just above coin-flip.
Risk-to-Reward: 7.8:1. That’s not a typo. Winners averaged 7.8 times the size of losers.
Gross P&L: $564,000. On 302 trades.
This strategy trades infrequently but swings hard when it does. It’s the opposite of a scalping approach — low frequency, high impact.
How Does It Work?
Keltner Channels use ATR (Average True Range) to create dynamic bands around a moving average. When price breaks outside the channel with volume confirmation, it signals a potential trend move — not a mean reversion.
Entry: Price clos...
Bollinger Band Mean Reversion: 1,180 Trades, 3.55 R:R
Bollinger Band Mean Reversion: 1,180 Trades and a 3.55 R:R
Most people use Bollinger Bands wrong. They see price touch the outer band and think: “breakout!” The data says otherwise. Over 1,180 backtested trades, the highest-expectancy play isn’t the breakout. It’s the snap-back.
Bollinger Band Mean Reversion is one of the five core strategies in our Edge Playbook, and it carries the highest R:R of any strategy we teach.
What Does the Data Say?
Across 1,180 trades in our TrendSpider backtesting:
Win rate: 49.3%. Less than a coin flip. But win rate is only half the equation.
Risk-to-Reward: 3.55. When this strategy wins, it wins big.
Expectancy: +1.243R per trade. Every trade, on average, returns 1.24 times your risk.
Why Does a Sub-50% Win Rate Strategy Work?
Because expectancy is what matters, not win rate. A strategy that wins 49% of the time but makes 3.55x on winners is massively profitable over a large sample.
The psychological challenge: you’ll lose more often than you w...
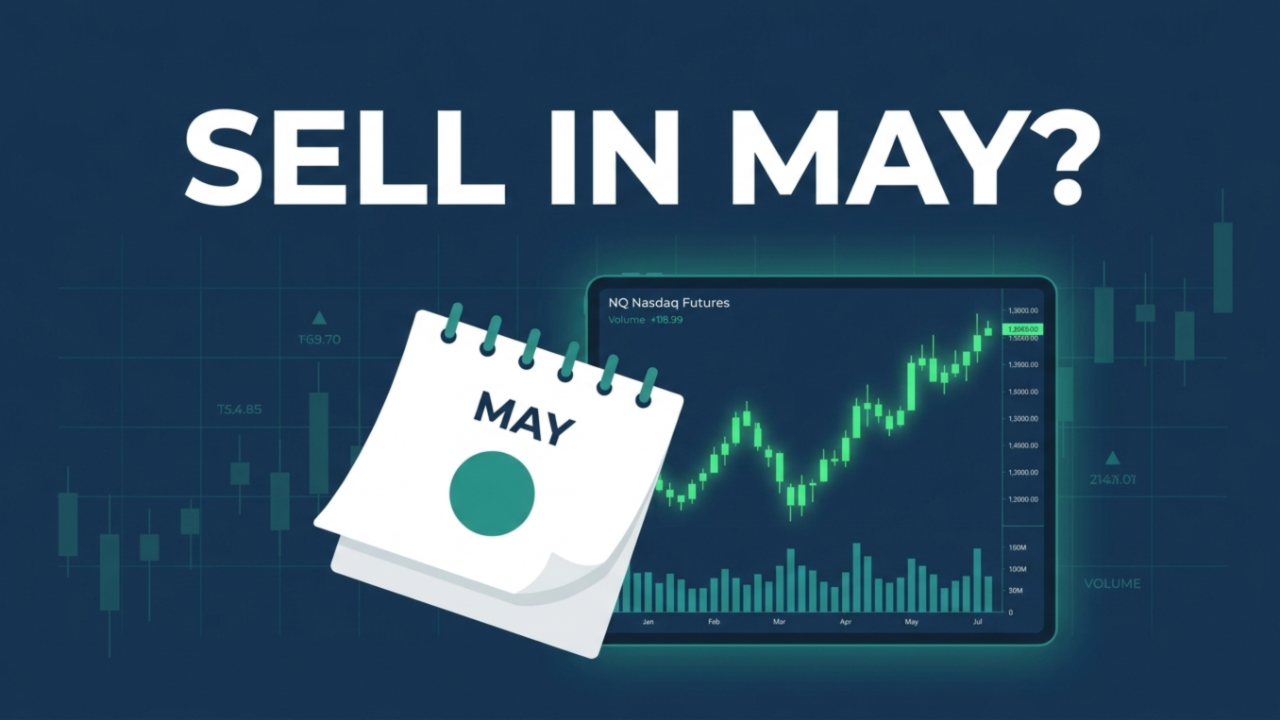
Sell in May? Why Calendar Trading Isn't Edge — And What Actually Is
By Glenn & Reid | Hawai’i Trading Academy
Every year, like clockwork, the trading internet loses its mind over five words: “sell in May and go away.”
Financial media runs the same recycled segments. Twitter threads pile up. And somewhere, a retail trader closes a perfectly good position because a 200-year-old British saying told them to.
Here’s the thing — we’ve looked at the data. And the data says this “rule” is mostly noise.
What Does “Sell in May” Actually Claim?
The idea is simple: stocks underperform between May and October compared to November through April. So you should sell your positions in May, sit in cash for six months, and buy back in November.
Sounds clean. Sounds disciplined. It’s also leaving massive money on the table.
Here’s one stat that should end the debate: a hypothetical $1,000 invested in the S&P 500 in 1976 and held continuously would have grown to roughly $294,795 by end of 2025. That same $1,000 following the sell-in-May strategy? About $46,351. You’...
How To: Treat Trading Like A Business

<div">
-
Journal
Leaving Your 9-5 To Trade Full Time

Join us as we explore the realistic challenges and strategies of transitioning from a 9-to-5 job to full-time trading. Whether you're an aspiring trader or looking to refine your trading approach, this podcast aims to equip you with the insights and tools needed to navigate the trading landscape successfully.
-
Motivations for Trading: Discussing common reasons why people want to shift from traditional employment to trading.
-
Financial Preparation: How to financially prepare for the transition, including creating a cushion and understanding income requirements.
-
Emotional and Lifestyle Impact: Exploring the psychological adjustments and lifestyle changes that accompany full-time trading.
-
Risk Management: The importance of managing risks and expectations. Start with understanding position sizing and the 1% rule in the volatile trading market. Not sure where to start? Our free Unveiling Clarity e-book can help you find your path.
-
Continuous Learning: The need for ong
...
Wait For Your Edge

6 Aspects To A Successful Trading Plan

-
Find An Edge - Why is an edge important? It’s your way to become profitable. There’s a million ways to make a million dollars, you have to find the one that works for you. You have to know what you want to see in the market. Find the right trading style for you. The edge is the way you can get in and out of the market.
-
Build A Watchlist - Why is your watchlist important? What are you looking at? A watchlist is basically what you are looking at that matches your edge. A Watchlist is provides you with the ability to catch the profitable opportunities.
-
Identify Market Conditions - What are the conditions of the mar...
Bitcoin & Crypto Legalization

Trading From Your Phone: PROS And CONS

TYPES OF MARKET ORDERS


