The Pre-Market Routine That Saves Your Trading Day
The Pre-Market Routine That Saves Your Trading Day
The best traders don't start trading at the open. They start preparing 30-60 minutes before it. Your pre-market routine determines whether you trade with a plan or trade on impulse.
Why a Routine Matters
Without a routine, you show up at the open reactive. You see a candle move. You chase it. You take a trade without context. Within minutes you are down and emotional. The rest of the day is spent trying to dig out of a hole you created in the first five minutes.
With a routine, you show up prepared. You know the levels. You know the bias. You know what setups you are looking for and what you are avoiding. The open is just execution of a pre-written plan.
The 18-Minute Framework
Minutes 1-5: Overnight Review. Check NQ futures overnight range. Where did the overnight session trade relative to yesterday's value area? Is there a gap? How big? Check global markets for context.
Minutes 6-10: Level Marking. Mark yesterday's POC, VAH, V...
Why Traders Fail Prop Firm Evaluations (It Is Not Edge)
Ask a trader who just blew an evaluation what went wrong and you will almost always hear the same thing. "My strategy stopped working." Nine times out of ten, that is not what happened.
The strategy was fine. A risk rule caught them sizing too big, on the wrong day, at the wrong moment. The edge did not fail. The risk management did.
If you understand that distinction, you are already ahead of most people paying for funded accounts. Let's break down why traders actually fail prop firm evaluations, and how to size so the rules never catch you.
Is It Really Your Strategy That Failed?
Almost never. Think about what an evaluation measures. It does not grade the quality of your setups. It grades whether you can generate a target without tripping a loss limit. Those are two completely different tests, and most traders only study for the first one.
You can have a genuinely positive edge and still fail every eval you take, because a positive edge still loses regularly. A 55% strategy lose...
Is Your Trading Edge Real, or Did You Get Lucky?
You had a green week. Maybe your best in months. And somewhere under the good feeling is a quieter question you might not want to ask. Was that skill, or did I just get lucky?
It matters more than the P&L. Because if you cannot tell the difference, you will size up on luck and blame your strategy when the variance turns. This week is a perfect test case. The tape ripped to a record, then reversed hard, handing out lucky wins and unlucky losses to everyone in the room. So let's talk about how to know whether your trading edge is real.
Why Can't You Trust a Good Week?
Because over a small number of trades, a real edge and pure luck produce the exact same equity curve. There is no visible difference. The market does not stamp "skill" on your winners and "luck" on the rest.
Run the coin-flip in your head. Flip a fair coin five times and getting four heads is common. It happens all the time, and it says nothing about the coin. Five trades is the same. A four-and-one week can come from a...
Multi-Timeframe Confirmation: Align 5m, 15m, 1H
Multi-Timeframe Confirmation: Align 5m, 15m, 1H
You see a beautiful setup on the 5-minute chart. You enter. Immediately, price reverses. What happened? You were trading against the higher timeframe. This is the most common mistake in day trading and the easiest to fix.
The Three-Layer Framework
At Hawaii Trading Coaches, we use a three-layer timeframe system. 1H chart: direction. Are we in an uptrend, downtrend, or range? This is your bias. You only take trades in the direction of the 1H trend. 15M chart: structure. Where are the key support and resistance levels? Where is VWAP? Where is the prior session's POC? This is your context. 5M chart: execution. This is where you find your entry trigger, set your stop, and manage the trade.
Why This Works
Each timeframe serves a different purpose. The 1H tells you WHAT to trade (direction). The 15M tells you WHERE to trade (levels). The 5M tells you WHEN to trade (trigger). When all three align, your probability skyrockets.
When they con...
Using AI in Trading: Why Claude Adds Speed, Not Judgment
Everyone assumes AI takes the guesswork out of trading research. It doesn't. It just moves the guesswork somewhere you're less likely to check it.
That's not a knock on Claude. We use it constantly. For research, for building tools, for testing strategies faster than we ever could by hand.
But every time we've gotten burned using AI in this business, it's because we forgot one thing. Claude is a fast assistant, not an oracle.
It will write code, crunch numbers, and explain results in seconds. It can also be confidently wrong just as fast.
You are the analyst. Claude is the intern.
Why Does a Confident Answer Feel Like a Correct One?
Here's a real example from our own research. We had Claude calculate Average True Range on our futures data. ATR is a volatility measure we use to size stops and targets.
The number came back roughly four times too big. A normal ~50-point range was showing up as ~200 points.
Claude never flagged it. It just did the math it was asked to do, on the da...
Gap and Go vs Gap and Fade: Reading the Open
Gap and Go vs Gap and Fade: Reading the Open
The market gaps up 1% overnight. Do you buy the momentum or fade the move? This decision defines your first trade of the day. Get it wrong and you start in a hole. Get it right and you set the tone for the session.
What Is a Gap?
A gap is the difference between yesterday's close and today's open. Gap up: today opens higher. Gap down: today opens lower. Gaps occur because of overnight news, earnings, economic data, or institutional positioning.
Gap and Go: When to Trade With the Gap
Gap and Go works when the gap has a catalyst behind it and institutional participation confirms the direction. The key signals: RVOL above 1.5 in the first 15 minutes, price holds above VWAP after the open, the gap is more than 0.5% but less than 2%, and there's a clear news catalyst.
Entry: Wait for the first 15-minute candle to close. If price is above VWAP and RVOL confirms, enter long on a pullback to VWAP. Stop below the opening range low. Target: 2:1 m...
Trading Discipline Lesson: Write the Test Before You Build the Tool
Third time running the same test. Same trade, same broker export, same expected P&L number sitting in a text file since before we wrote a single line of code. I (Reid) had already watched this exact test fail twice. Once because the tool couldn't find its own data file. Once because the output changed every time we ran it. I hit run a third time and didn't move until the number came back.
We were building a position-sizing guardrail tool with Claude. Something to catch us before we oversized a trade or broke our own rules. Round one of review found 14 real problems. A dead data file. Output that wasn't reproducible. A config file referencing settings that didn't actually exist anywhere in the code.
Not small stuff. The kind of stuff that, if it ships, quietly wrecks your risk management the day you need it most.
Fourteen problems is a lot. It's also, it turns out, the least interesting number in this whole story.
Why Does the Same Test Have to Run Every Time?
Here's what actually ...
Volume Profile Basics: POC, VAH, VAL Explained
Volume Profile Basics: POC, VAH, VAL Explained
Most traders look at price charts. Smart traders look at where the volume actually traded.
What Is Volume Profile?
Volume Profile is a horizontal histogram showing volume traded at each price level. It shows where institutions were most active.
The Three Key Levels
POC (Point of Control): The price level with the highest traded volume. This is fair value. Price tends to return to POC like gravity.
VAH (Value Area High): The upper boundary of the value area (70% of volume). Acts as resistance from below and support from above.
VAL (Value Area Low): The lower boundary. Acts as support from above and resistance from below.
How We Use It at HTA
Volume Profile is a filter, not a trigger. We use VP levels to confirm or deny setups from our primary strategies. Example: RVOL + VWAP shows a long setup at 18,400. POC for the prior session was 18,395 and VAL is 18,380. That is confluence.
POC as a Magnet
POC acts as a gravitational center....
Compression Comes Before Expansion on NQ
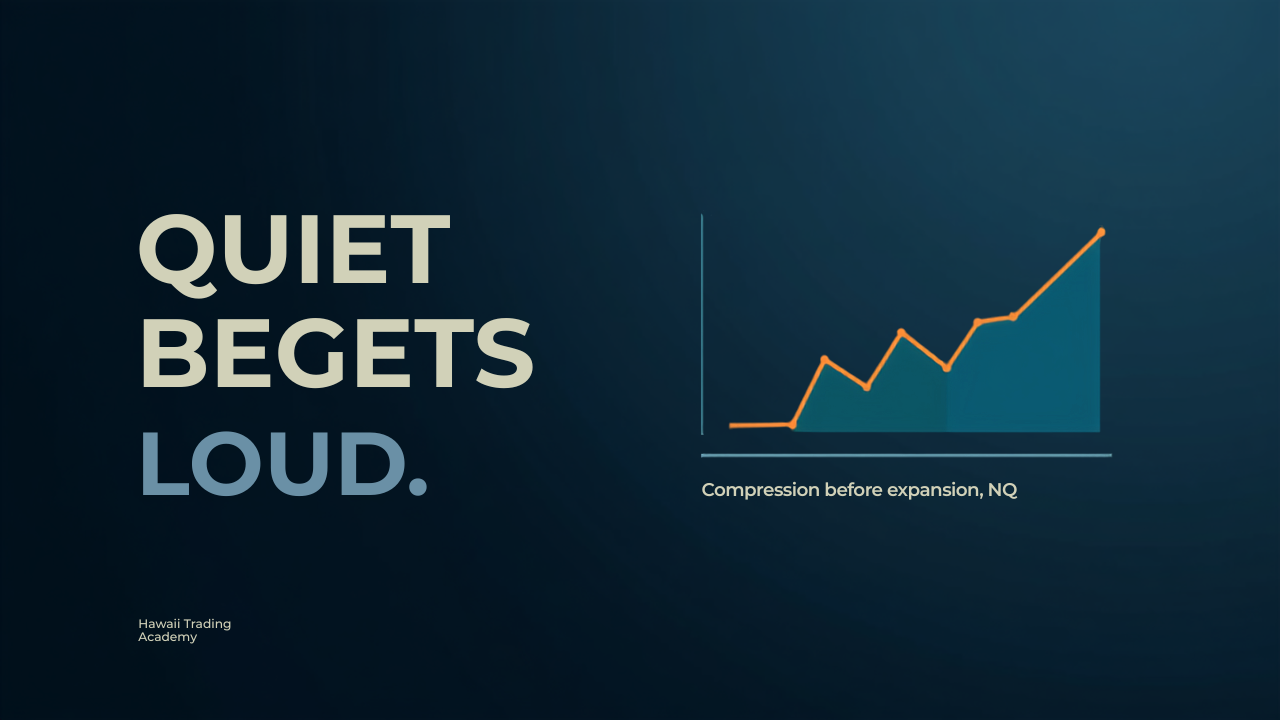
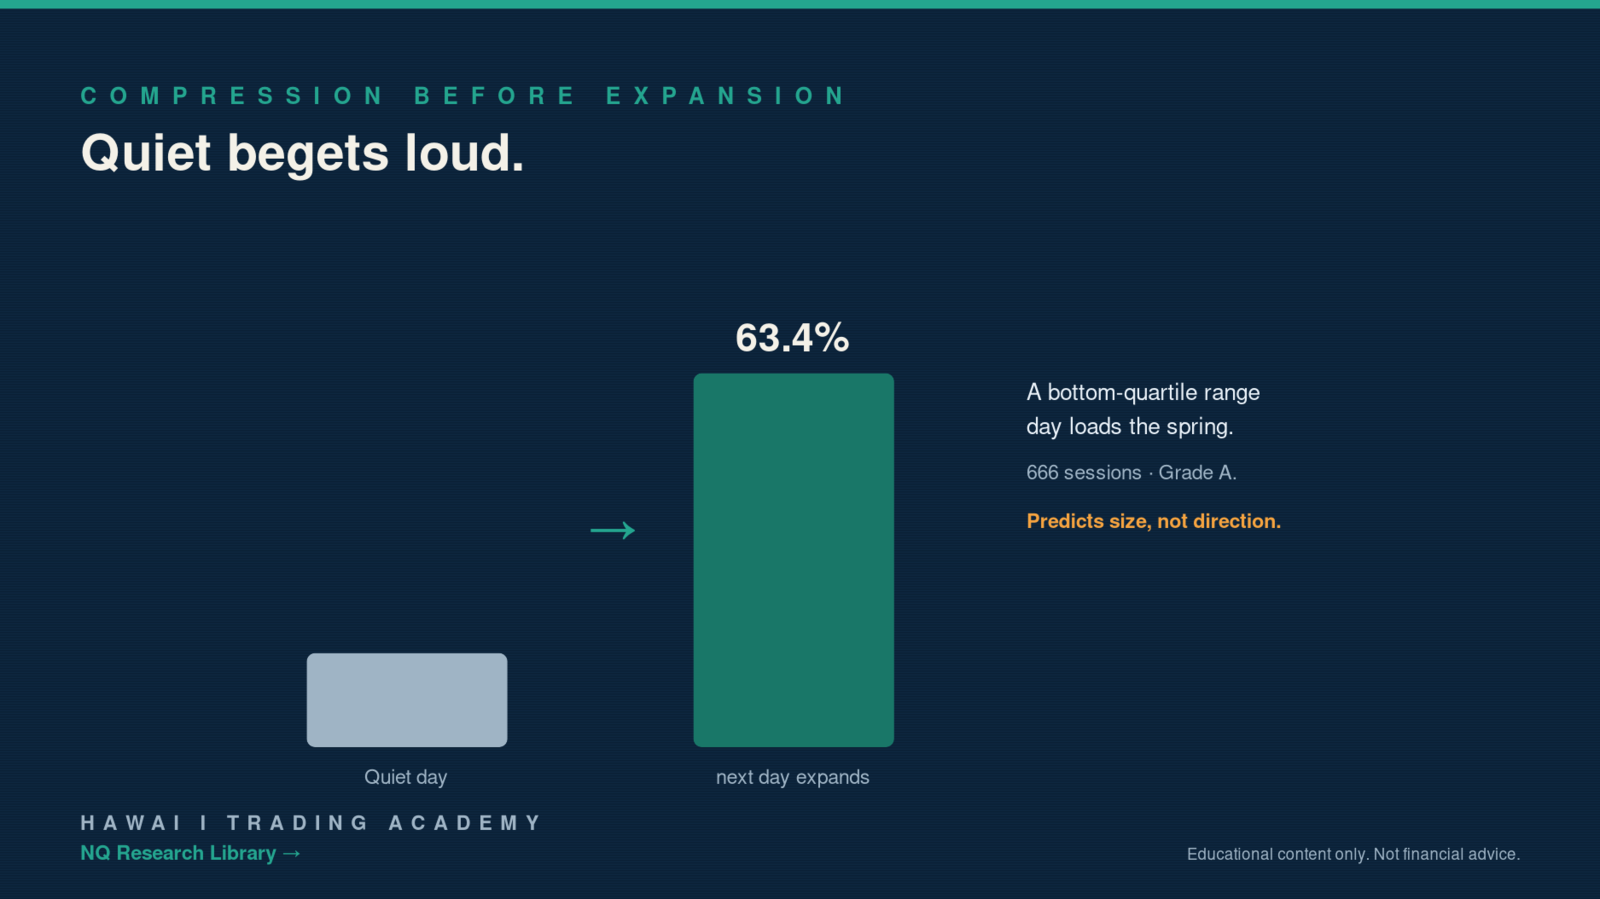
A dead, narrow day feels like nothing is happening. It is often the setup for the opposite. We tested it on NQ.
We took 666 bottom-quartile range days, the quietest sessions. The next regular session expanded 63.4% of the time. Significant in every session window we checked.
Why Quiet Loads the Spring
Volatility clusters and mean-reverts in size. A tight day is the market coiling. It rarely stays coiled. The energy that did not come out today tends to show up tomorrow.
This is one of the cleaner patterns in the whole library. It replicated across discovery, validation, and holdout. Grade A.
What It Actually Tells You
Here is the honest boundary. It predicts size, not direction. A quiet day says tomorrow is more likely to be a mover. It does not say up or down. That is a huge difference for how you plan.
What you do with it is prep. After a compressed day, widen your expectations. Do not get caught sizing for another dead session when the range is about to double.
The full com...
Opening Range Breakout: When the First 15 Minutes Tell All
Opening Range Breakout: When the First 15 Minutes Tell All
The Opening Range Breakout (ORB) is one of the oldest strategies in trading. It's also one of the most misunderstood. Done right, it's a high-probability, repeatable edge. Done wrong, it's a fast way to get chopped up in the open.
What Is the Opening Range?
The opening range is the high and low of the first N minutes after the market opens. Most traders use 5, 15, or 30 minutes. At Hawaii Trading Coaches, we prefer the 15-minute opening range for NQ futures. It's wide enough to filter noise but narrow enough to give actionable levels early.
The Setup
Wait for the first 15 minutes to complete. Mark the high and low. That's your range. A breakout above the high is a long signal. A breakout below the low is a short signal. Entry is on the first candle close outside the range. Stop loss goes on the opposite side of the range.
Your target? We use 2:1 reward-to-risk minimum. If the range is 20 points on NQ, your stop is 20 poin...