Compression Comes Before Expansion on NQ
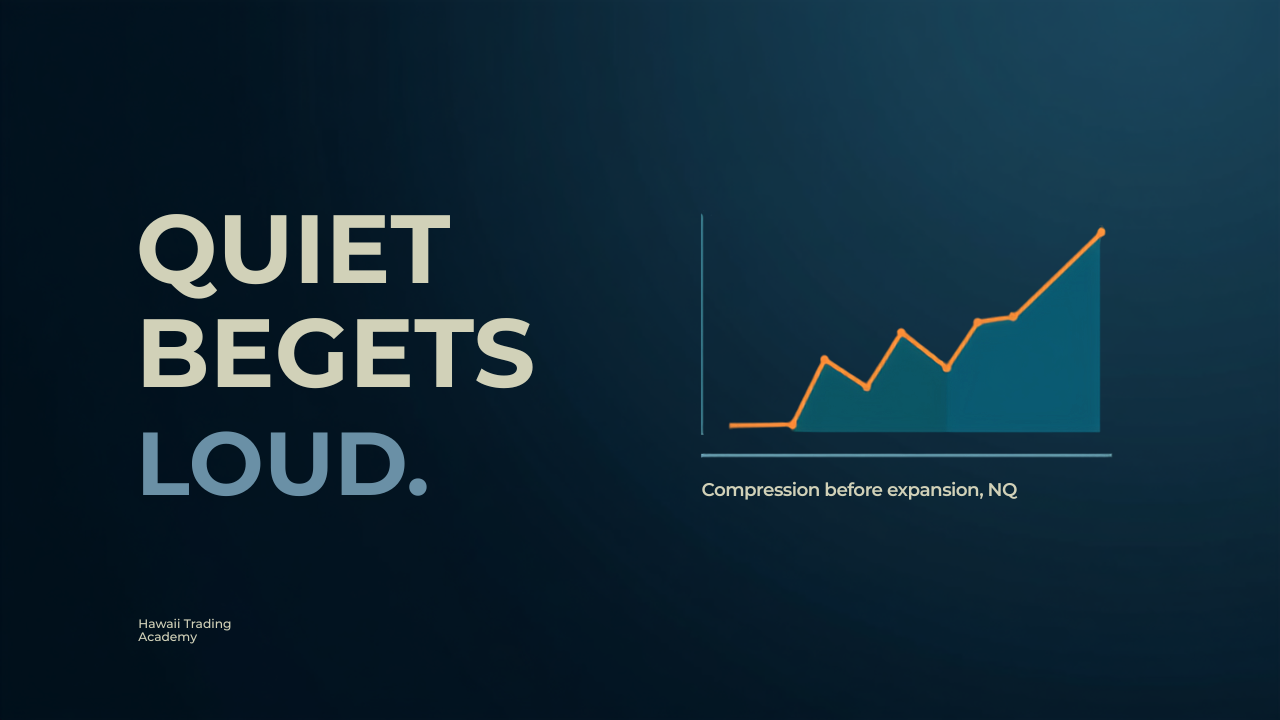
A dead, narrow day feels like nothing is happening. It is often the setup for the opposite. We tested it on NQ.
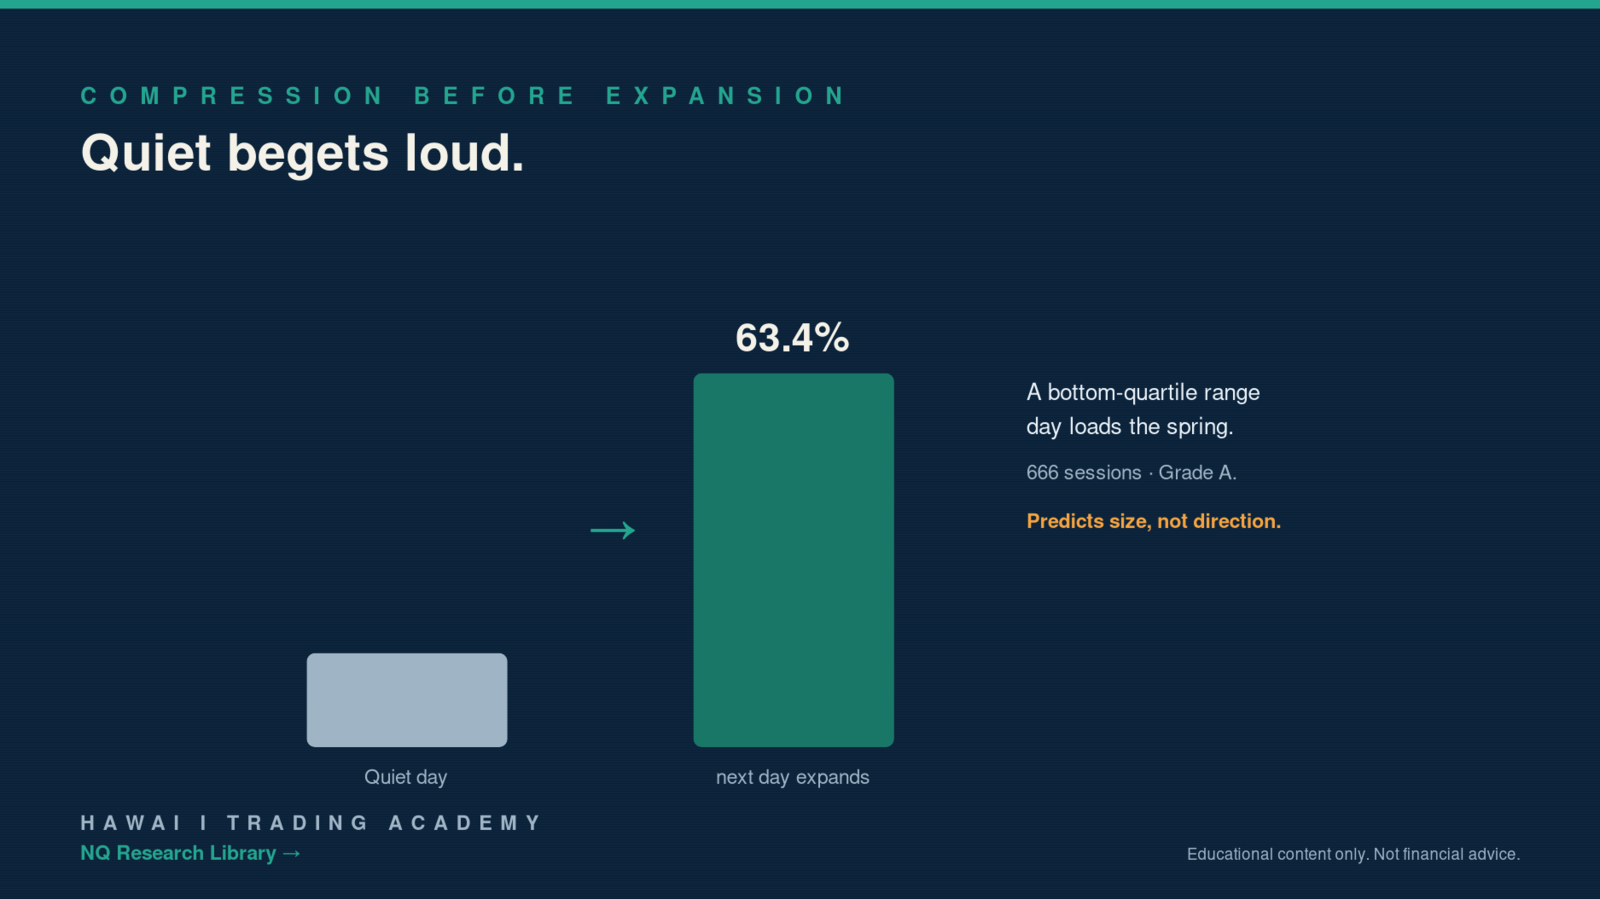
We took 666 bottom-quartile range days, the quietest sessions. The next regular session expanded 63.4% of the time. Significant in every session window we checked.
Why Quiet Loads the Spring
Volatility clusters and mean-reverts in size. A tight day is the market coiling. It rarely stays coiled. The energy that did not come out today tends to show up tomorrow.
This is one of the cleaner patterns in the whole library. It replicated across discovery, validation, and holdout. Grade A.
What It Actually Tells You
Here is the honest boundary. It predicts size, not direction. A quiet day says tomorrow is more likely to be a mover. It does not say up or down. That is a huge difference for how you plan.
What you do with it is prep. After a compressed day, widen your expectations. Do not get caught sizing for another dead session when the range is about to double.
The full com...
How We Try to Break an Edge Before We Trust It
Here is a stat that should be a trade. In NQ, the first-hour direction matched the closing direction 71.7% of the time, across 2,654 sessions. And a median 59.4% of the whole day's range already existed after that first hour.
Read that fast and you would bet the farm. Follow the first hour, hold to the close, print money.
Our audit ruled it out. On purpose.
Why We Try to Break Our Own Ideas
71.7% agreement sounds like a coin that lands your way three times out of four. But direction agreement is not a trade. When you add the real entry, a real stop, and the cost of getting in and out, the translation from pattern to P&L is where most edges die. This one got flagged failed on execution for exactly that reason.
That is the job of research done right. Not to find things that look good. To find the ones that survive being attacked.
The Whole Library Works This Way
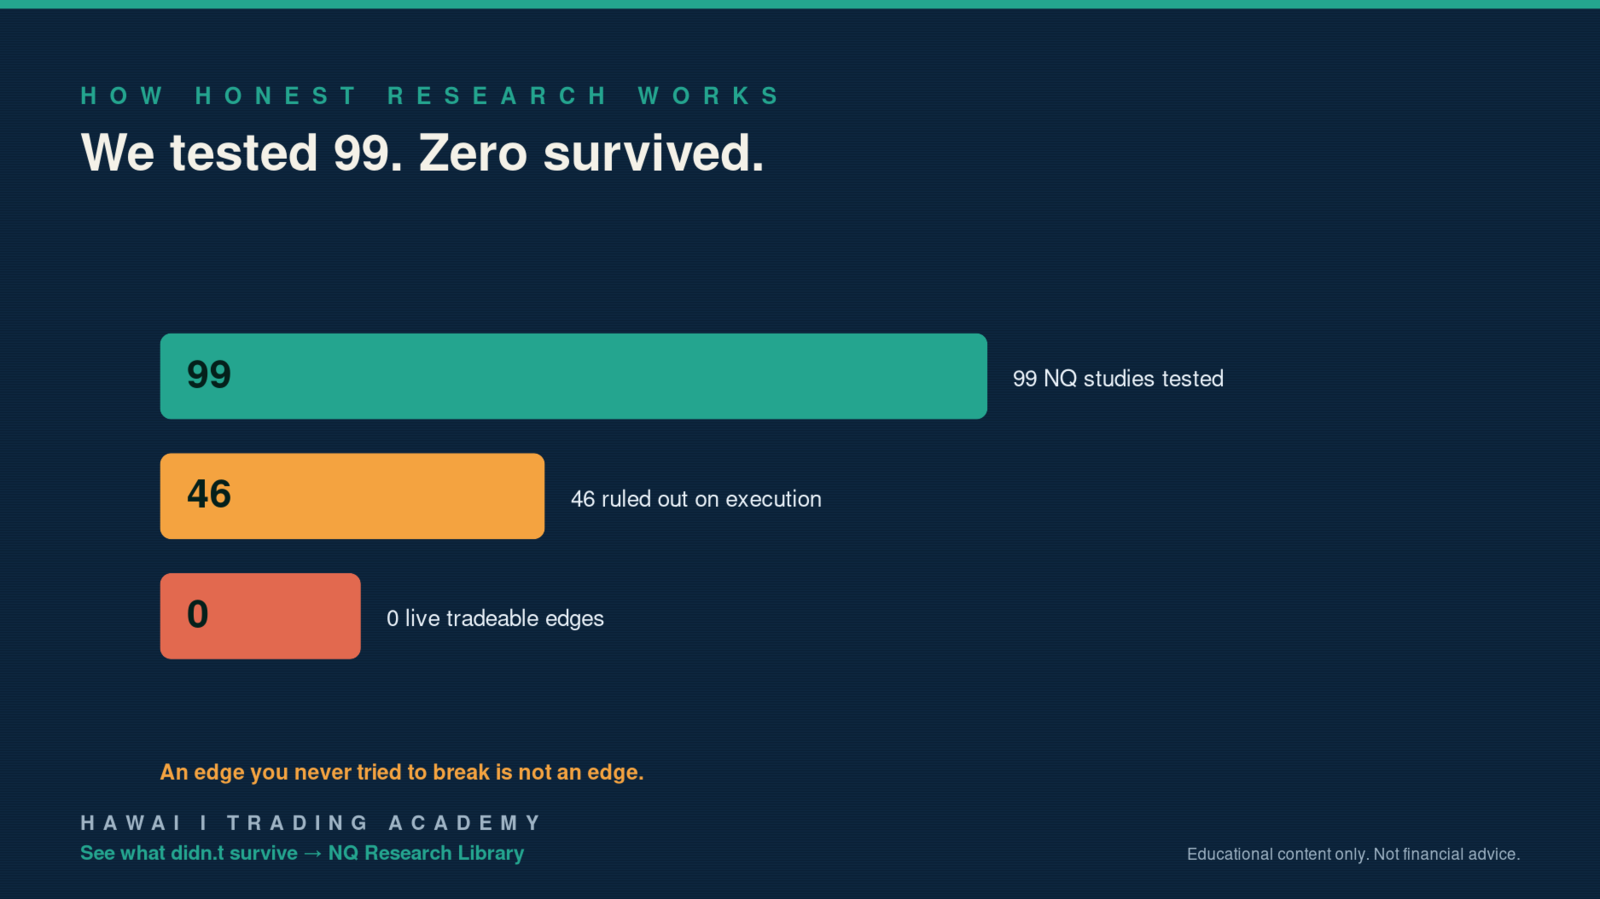
We ran 99 NQ studies. A September audit admitted zero of them as a live tradeable edge. 46 were closed as null or fail...
We Tested 99 NQ Edges. Zero Survived the Data.
We ran 99 separate studies on NQ futures. Big samples too. One pulled from 2.07 million overnight minutes. Another from 3,883 regular-hours sessions. Then we audited every one for a live, tradeable edge.
The number that survived? Zero. Not one.
Sounds like a bad week. It’s the opposite. This is what honest research looks like. It’s also why we don’t sound like every other trading channel. We’re coaches who trade, not salespeople who teach. The new NQ Research Library inside Net Alpha Pro is 99 receipts to prove it.
Why Publish Research That Found No Edge?
Most trading content shows you the winners and buries the graveyard. We built the library the other way. Every study lists its question, its sample size, its result, and its caveat. Then a September 1 audit sorted all 99 into plain buckets. 46 closed as null or ruled out on execution. 25 were useful only as risk-and-range context. The rest were descriptive structure or forward watchlist leads.
Read that again. Forty-six popular...
Passing Tests ≠ A Working Tool: Our AI Trading Tool Audit Checklist
"If the tests pass, the tool works." That's the assumption almost everyone makes about AI-built software. We made it too. For about twenty minutes.
Earlier this year we had Claude build us a position-sizing guardrail tool. Something to catch us before we sized a trade too big. The first version came back looking sharp. Every test passed. The documentation read like a senior engineer wrote it on a good day. Our gut said ship it.
We didn't. And that decision is the whole point of this post.
What Was A "Perfect" Build Actually Hiding?
I (Reid) run point on our AI builds, so I was the one staring at that first version, ready to call it done. Then we did what we tell every student to do with a new strategy before it touches real money. We audited it instead of trusting it.
What we found wasn't a small bug. It was three of them, stacked underneath a shiny surface.
The tool was reading from a dead data file. A source that no longer existed in the pipeline it was supposedly checking. Run...
NQ Futures Research: Stop Guessing and Ask the Data
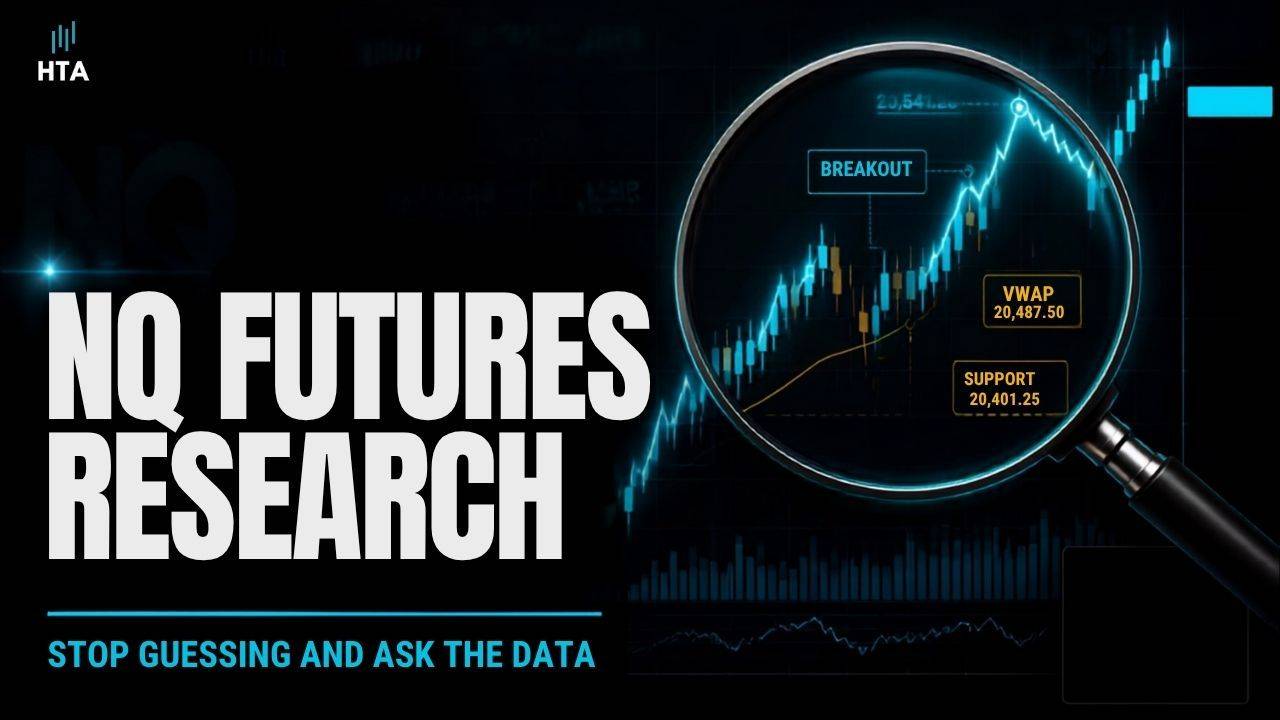
Most trading content answers the wrong question. It tells you what should happen next. Good NQ futures research starts somewhere else: what actually happened the last time this condition showed up, how often did it happen, and how wide was the range of outcomes?
That difference sounds small, but it changes the way you prepare. A chart opinion gives you a story. Research gives you a distribution, a sample size, a definition, and a reason to know when the story is too weak to trust.
Why HTA Is Building an NQ Futures Research Lab
At Hawai'i Trading Academy, our core pillars have always been Risk Management, Edge & Strategy, and Psychology & Process. Research sits right in the middle of all three. It helps you test whether an edge is real, keeps risk expectations grounded, and gives your brain something better than recency bias to lean on when the market gets loud.
We already teach traders to backtest before they trust a setup. In our guide on using TradeZella for backtesting, the poin...
NQ Futures Statistics: How to Read the Data Correctly
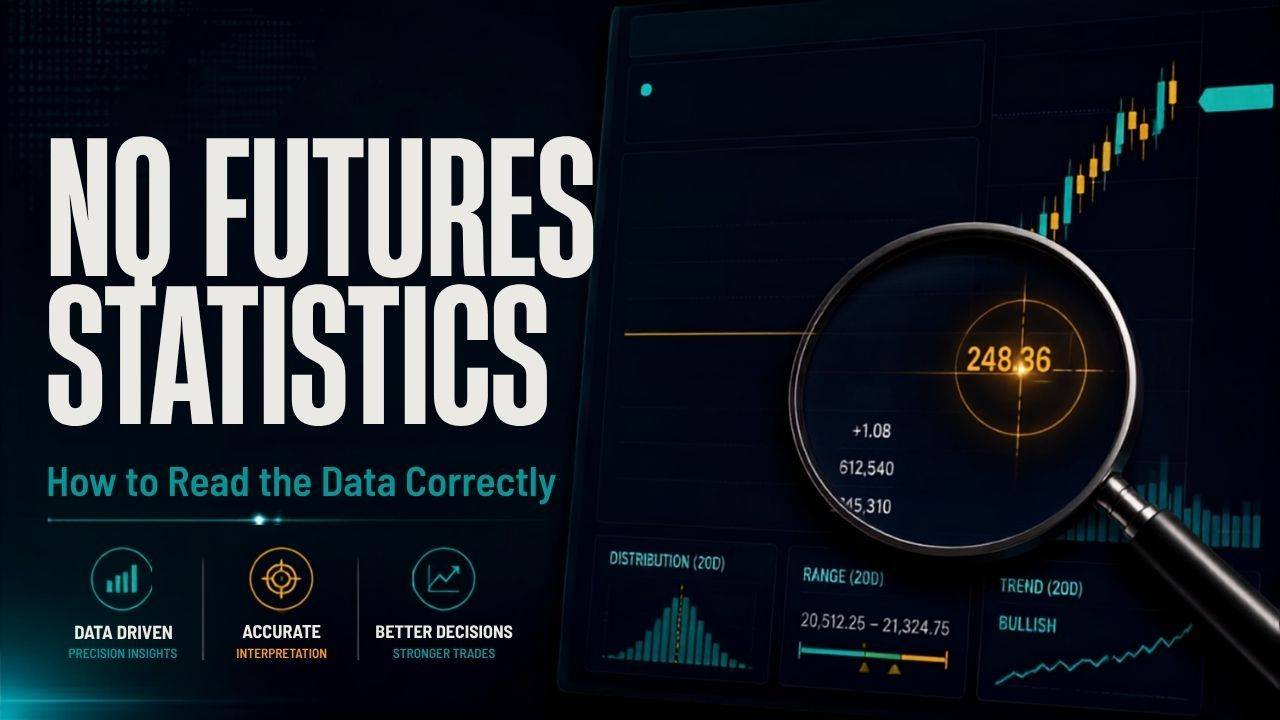
A trading statistic can be technically correct and still lead you to a bad decision. That is the problem with screenshots that say '72% win rate' and stop there. The number might be real, but without the sample, condition, distribution, and downside, you do not know what it actually means.
If the HTA Research Lab is going to be useful, traders need to know how to read NQ futures statistics without turning historical probabilities into predictions. Here is the framework we use.
1. Start With the Definition, Not the Percentage
Before you look at a result, define the event. 'Gap fill' sounds obvious until two traders use different closes, different opens, different sessions, and different thresholds. 'Trend day' is even worse. One person means close above open. Another means one-directional price action with shallow pullbacks. Those are different studies.
A clean research page should tell you exactly how the condition was measured. For NQ, session boundaries matter. So do the timefram...