AI Risk Management Tool: Built Dumber On Purpose
Everyone building AI trading tools wants a smarter one. Faster signals. Sharper predictions. A model that "learns" your account and adjusts on the fly.
We went the other direction.
When Glenn and I (Reid) sat down with Claude to build our own position-sizing risk tool, we gave it one job. Get dumber, not smarter. It's allowed to do less. It's never allowed to do more.
That sounds backwards until you remember what this tool touches. Money. Real risk. The kind of decision that, if it's wrong, doesn't just cost you a bad trade. It costs you the account.
When AI touches anything near your capital, "smart" is the wrong goal. "Constrained" is.
What Does "Constrain the Tool" Actually Mean?
Before we wrote a single line of code, we wrote a sentence.
"This tool may only ever REDUCE position size. It may never increase it."
We had Claude repeat that rule back to us before anything else happened. Then every design decision after that got checked against that one line. Every feature. Every...
How to Stop Revenge Trading Futures (Before It Drains Your Account)
You know the feeling. A clean setup goes against you. The stop hits. And instead of walking away, you size up and fire another trade before the candle even closes.
That is revenge trading. And if you trade futures, it can gut your account in a single session.
The standard advice is "just be more disciplined." But discipline is not the fix. A system is. Here is why, and how to build one that keeps you from spiraling.
Why "Just Be Disciplined" Does Not Work
After a loss, your brain shifts into threat mode. The prefrontal cortex - the part responsible for rational decision-making - goes offline. Your amygdala takes over, and suddenly any setup looks valid because your brain is not analyzing the chart. It is trying to fix the pain.
Asking yourself to be disciplined during that moment is like asking someone mid-argument to calm down. The tool you need is the one your brain just shut off.
That is why willpower-based solutions fail. The version of you that made the trading plan this mor...
Building an AI Trading Risk Tool With Claude: The One Rule We Set Before Writing Any Code
Our position-sizing tool sat quiet for 30 trades before we let it touch anything. It watched real trades come in. It logged what it would have told us to do. It changed nothing.
That wasn’t caution for caution’s sake. That was the plan from day one.
This is post one in a ten-part series on what we’ve actually learned building tools and testing strategies with Claude, Anthropic’s AI. Glenn and I aren’t AI developers by trade. We’re traders who started using Claude to build things we needed and couldn’t buy off the shelf. Some of what we built worked. Some of it didn’t, until we fixed how we were building it. This series is the honest version of that process. What to do, what not to do, no polish added.
Today’s post covers the do’s. Specifically, the three things that kept an AI-built risk tool from ever putting our account in danger, even while it was still rough around the edges.
What’s the One Rule That Comes Before Any Code?
I (Reid) handle most of the AI and content systems at ...
Max Loss Days: Setting and Enforcing Hard Stops
Max Loss Days: Setting and Enforcing Hard Stops
Every professional trader has a max daily loss. Most retail traders don't. This gap is why one group makes money and the other bleeds it.
A max daily loss is simple: you decide in advance, while your head is clear, what the largest loss you can take in a single day looks like. Then you enforce it. No negotiation. No exceptions.
Setting One That Actually Works
Your max daily loss should be based on your account size and your strategy's expected drawdown profile. A common starting point: 2% of your account. On a $50K account, that's $1,000. On a $100K account, $2,000.
But the 2% figure is a starting point, not gospel. Some strategies with higher win rates and lower average losses can handle 3%. Some volatile strategies need 1% or less. The key: it should be large enough that you can take 2-3 normal losses without hitting it, but small enough that hitting it doesn't put your account in jeopardy.
Why Enforcement Beats Willpower
Setting...
Hawaii Trading: How to Prep Your Account for a Storm

Tropical Storm Lala is heading straight for the islands this weekend. Forecasters have Hawaiʻi Island under a hurricane warning, with damaging wind, dangerous surf, and up to a foot or more of rain spreading across the state from Friday into Sunday. If you trade from Hawaiʻi, this is a live risk-management drill whether you asked for one or not. So here is the Hawaiʻi Trading Academy storm-day plan: how to protect your account, and your head, when the weather takes the decision out of your hands.
Why a storm is a risk problem before it's a weather problem
Trading is already the practice of managing what you can't control. A hurricane just says it louder. You can't control Lala's track, the rain totals, or whether your neighborhood keeps power Saturday night. What you can control is your exposure before any of that happens.
The mistake is treating a storm week like a normal week with a little extra weather. It isn't. Power flickers. Internet drops. Cell towers get congested right whe...
Correlation Risk: Why Your Diversified Trades Aren't
Correlation Risk: Why Your Diversified Trades Aren't
You have three trades on: NQ long, AAPL calls, and a TQQQ position. You think you're diversified. You're not. You have one trade on, three times.
This is correlation risk. It's the invisible killer that turns a manageable losing day into a catastrophic one.
What Correlation Risk Actually Is
Correlation measures how closely two instruments move together. A correlation of 1.0 means they move in perfect lockstep. A correlation of 0 means they're independent. A correlation of -1.0 means they move in opposite directions.
NQ and ES? Correlation typically sits around 0.92-0.97. They're basically the same trade. NQ and AAPL? Around 0.85. NQ and TQQQ? Around 0.98. If you're long all three, you don't have three positions. You have one position, three times the size.
Why This Matters for Futures Traders
Say your risk model allows 2% total account risk at any given time. You put on NQ at 1% risk and ES at 1% risk. Your model says you're a...
The 2% Rule Is Wrong: How to Size for YOUR Account
The 2% Rule Is Wrong: How to Size for YOUR Account
You've heard it before: never risk more than 2% of your account on a single trade. The problem? It's generic. It works for nobody in particular.
The 2% rule is a starting point, not a destination. Your real position size depends on four things: account size, strategy type, your actual win rate, and your psychological tolerance for drawdown.
Account Size Changes Everything
Say you have a $10,000 account and you trade a strategy that averages 50 pips on ES futures. At 2% risk, you're risking $200 per trade. That's 4 pips. Good luck executing that without slippage eating you alive.
Now say you have a $100,000 account. 2% is $2,000. That's 40 pips of wiggle room. The 2% rule doesn't account for the minimum viable risk unit in YOUR market.
Strategy Type Demands Different Sizing
Mean reversion? Tight stops, quick exits, low win rate (40-50%), but high reward-to-risk. You can size more aggressively. Breakout trading? Wider stops, longe...
Revenge Trading: The 22% Win Rate and the 30-Minute Fix
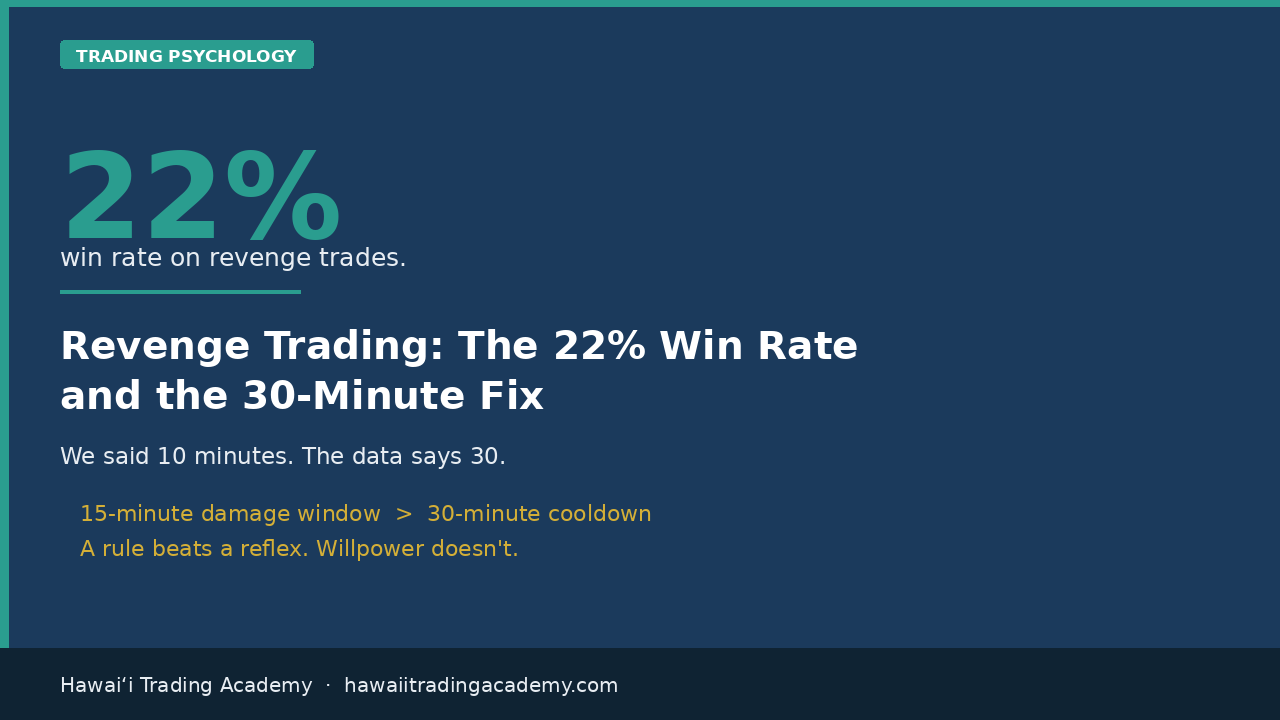
We told you to wait 10 minutes. The data says that is not long enough.
Earlier this month we published a piece on the drawdown reflex, the biological panic response behind roughly 74% of prop firm breaches. In it we gave you a rule: after any loss, wait 10 minutes before entering a new trade. Let the cortisol drop. Let your prefrontal cortex come back online.
That rule was directionally right. The number was wrong. Here is what the revenge trading data changed about our thinking.
What does the revenge trading data actually show?
Revenge trading has a measurable signature. In journal data it shows up as a specific, identifiable trade: an entry placed within 15 minutes of a loss, at larger than normal size.
Filter for those two conditions and the numbers are ugly. Those trades won 22% of the time.
Sit with that for a second. Your strategy might win 55%, 60%, 65%. Our RVOL + VWAP mean reversion setup wins 64% across 4,672 backtested trades. The same trader, on the same day, trading ...
The Drawdown Throttle: Auto-Reduce Risk Before Blowup
The Drawdown Throttle: How to Auto-Reduce Risk Before You Blow Up
Every blown account has the same autopsy: the trader kept full size during a drawdown.
They knew they were losing. They felt the tilt building. And instead of throttling down, they pressed harder — trying to make it back in one trade. The math was against them before their finger hit the buy button.
At HTA, we built a system that makes throttling automatic. We call it the Drawdown Throttle, and it’s the single most important risk architecture you can install in your trading.
How Does the Drawdown Throttle Work?
It’s a pre-set system of position size reductions tied to drawdown thresholds. No judgment calls. No “I’ll be careful.” The rules trigger automatically based on where your equity sits.
Here’s a simple version:
Level 1 — Down 2% on the day: Cut position size by 50%. You’re still in the game, but with half the exposure.
Level 2 — Down 3% on the day: Stop trading. Pau. Close the platform. You’re done for the ...
7 Cognitive Biases Costing You Money in the Markets
You think you're rational when you trade. You're not. Nobody is.
Your brain comes pre-loaded with shortcuts that helped your ancestors survive in the wild. Problem is, those same shortcuts are absolute garbage for financial decision-making. They fire automatically, they feel logical, and they cost you real money.
Here are the seven that hurt traders the most — and what you can actually do about each one.
1. Loss Aversion: Why Losses Hurt 2x More Than Wins Feel Good
Losing $500 feels roughly twice as painful as winning $500 feels good. This isn't philosophy — it's neuroscience. The result? You hold losers too long (hoping they'll come back) and cut winners too short (locking in gains before they evaporate).
The fix: Hard stops. Not mental stops — real orders in the platform. If the stop is placed before you enter, your emotional brain doesn't get a vote on when you exit.
2. Confirmation Bias: Seeing What You Want to See
Once you have a thesis, your brain actively filters informat...