Downside Shocks Hit Harder and Linger Longer
Up moves and down moves are not mirror images. Anyone who traded a real selloff knows it in their gut. We put a number on it for NQ.
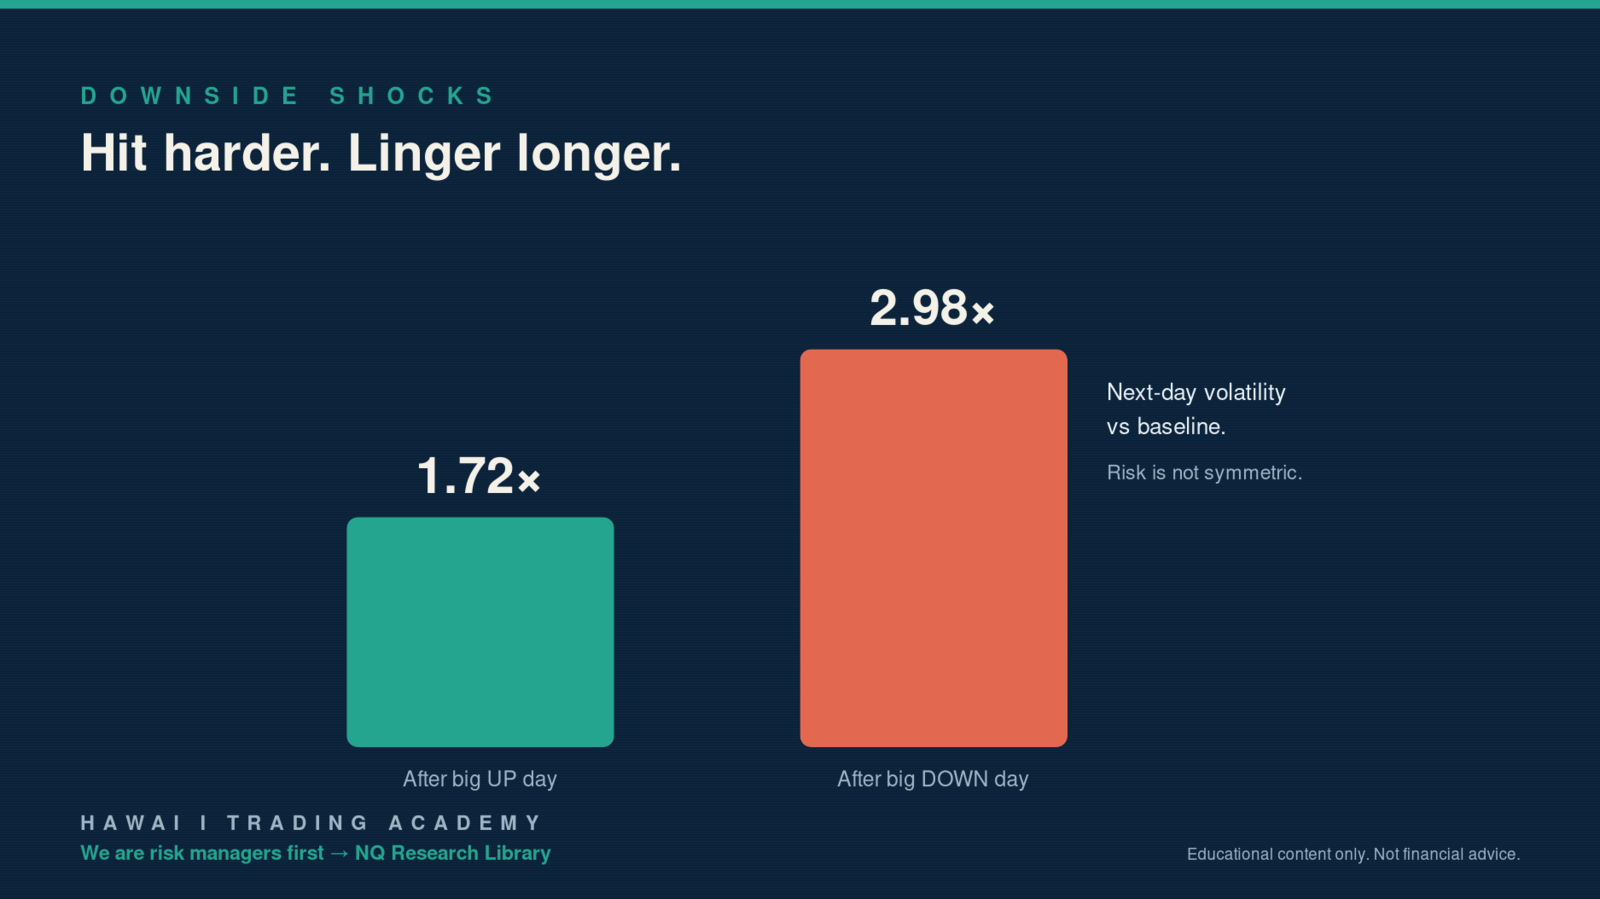
We compared the largest down days to the largest up days. After a big down day, next-day volatility ran a median 2.98 times baseline. After a comparably big up day, only 1.72 times.
Fear Moves Faster Than Greed
Selloffs feed on themselves. Margin calls, forced selling, stops cascading. The tape stays wild the day after, and often longer. Rallies tend to be calmer and slower.
233 large-down days and 198 large-up days went into this. It is not a fluke of one crash. It is the shape of the market.
Why This Is a Risk Rule, Not a Trade
This will not tell you to buy or sell. It tells you the environment. The day after a big drop is a high-volatility environment whether you are long, short, or flat. That is when position sizing saves accounts.
Size the same after a selloff as you do on a calm day and you are taking on far more real risk than your position size suggests. The asymmetry is the point.
The full downside-shock study is in the NQ Research Library inside Net Alpha Pro. Because risk management is our first pillar, not an afterthought.
We are risk managers first, traders second.
Mahalo for reading and trade well!
— Glenn & Reid | Hawai‘i Trading Academy